This series of maps presents an illustrated narrative of some of the patterns in incentives for different states. As these charts and maps show, incentives have grown enormously over the past 25 years. But there has been variation in when and where incentives have grown in the various states. Incentives in general are relatively untargeted based on whether an industry provides a lot of jobs, wages, or R&D, but some states do more targeting. States in general underinvest in providing more effective incentives, such as customized job training, and don't do enough to make incentives more effective by front-loading them. However, there are some exceptions among the states.
(1) Business incentives tripled from 1990 to 2015.
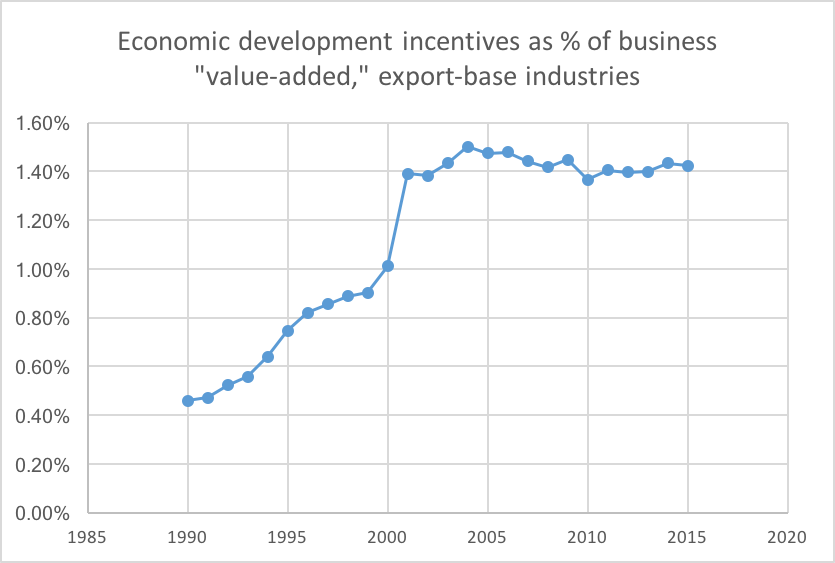
Chart Data
Most of this increase occurred from 1990 until 2001. Since then, some states have increased incentives while others have cut back. Business incentives today average over 30 percent of state and local business taxes.
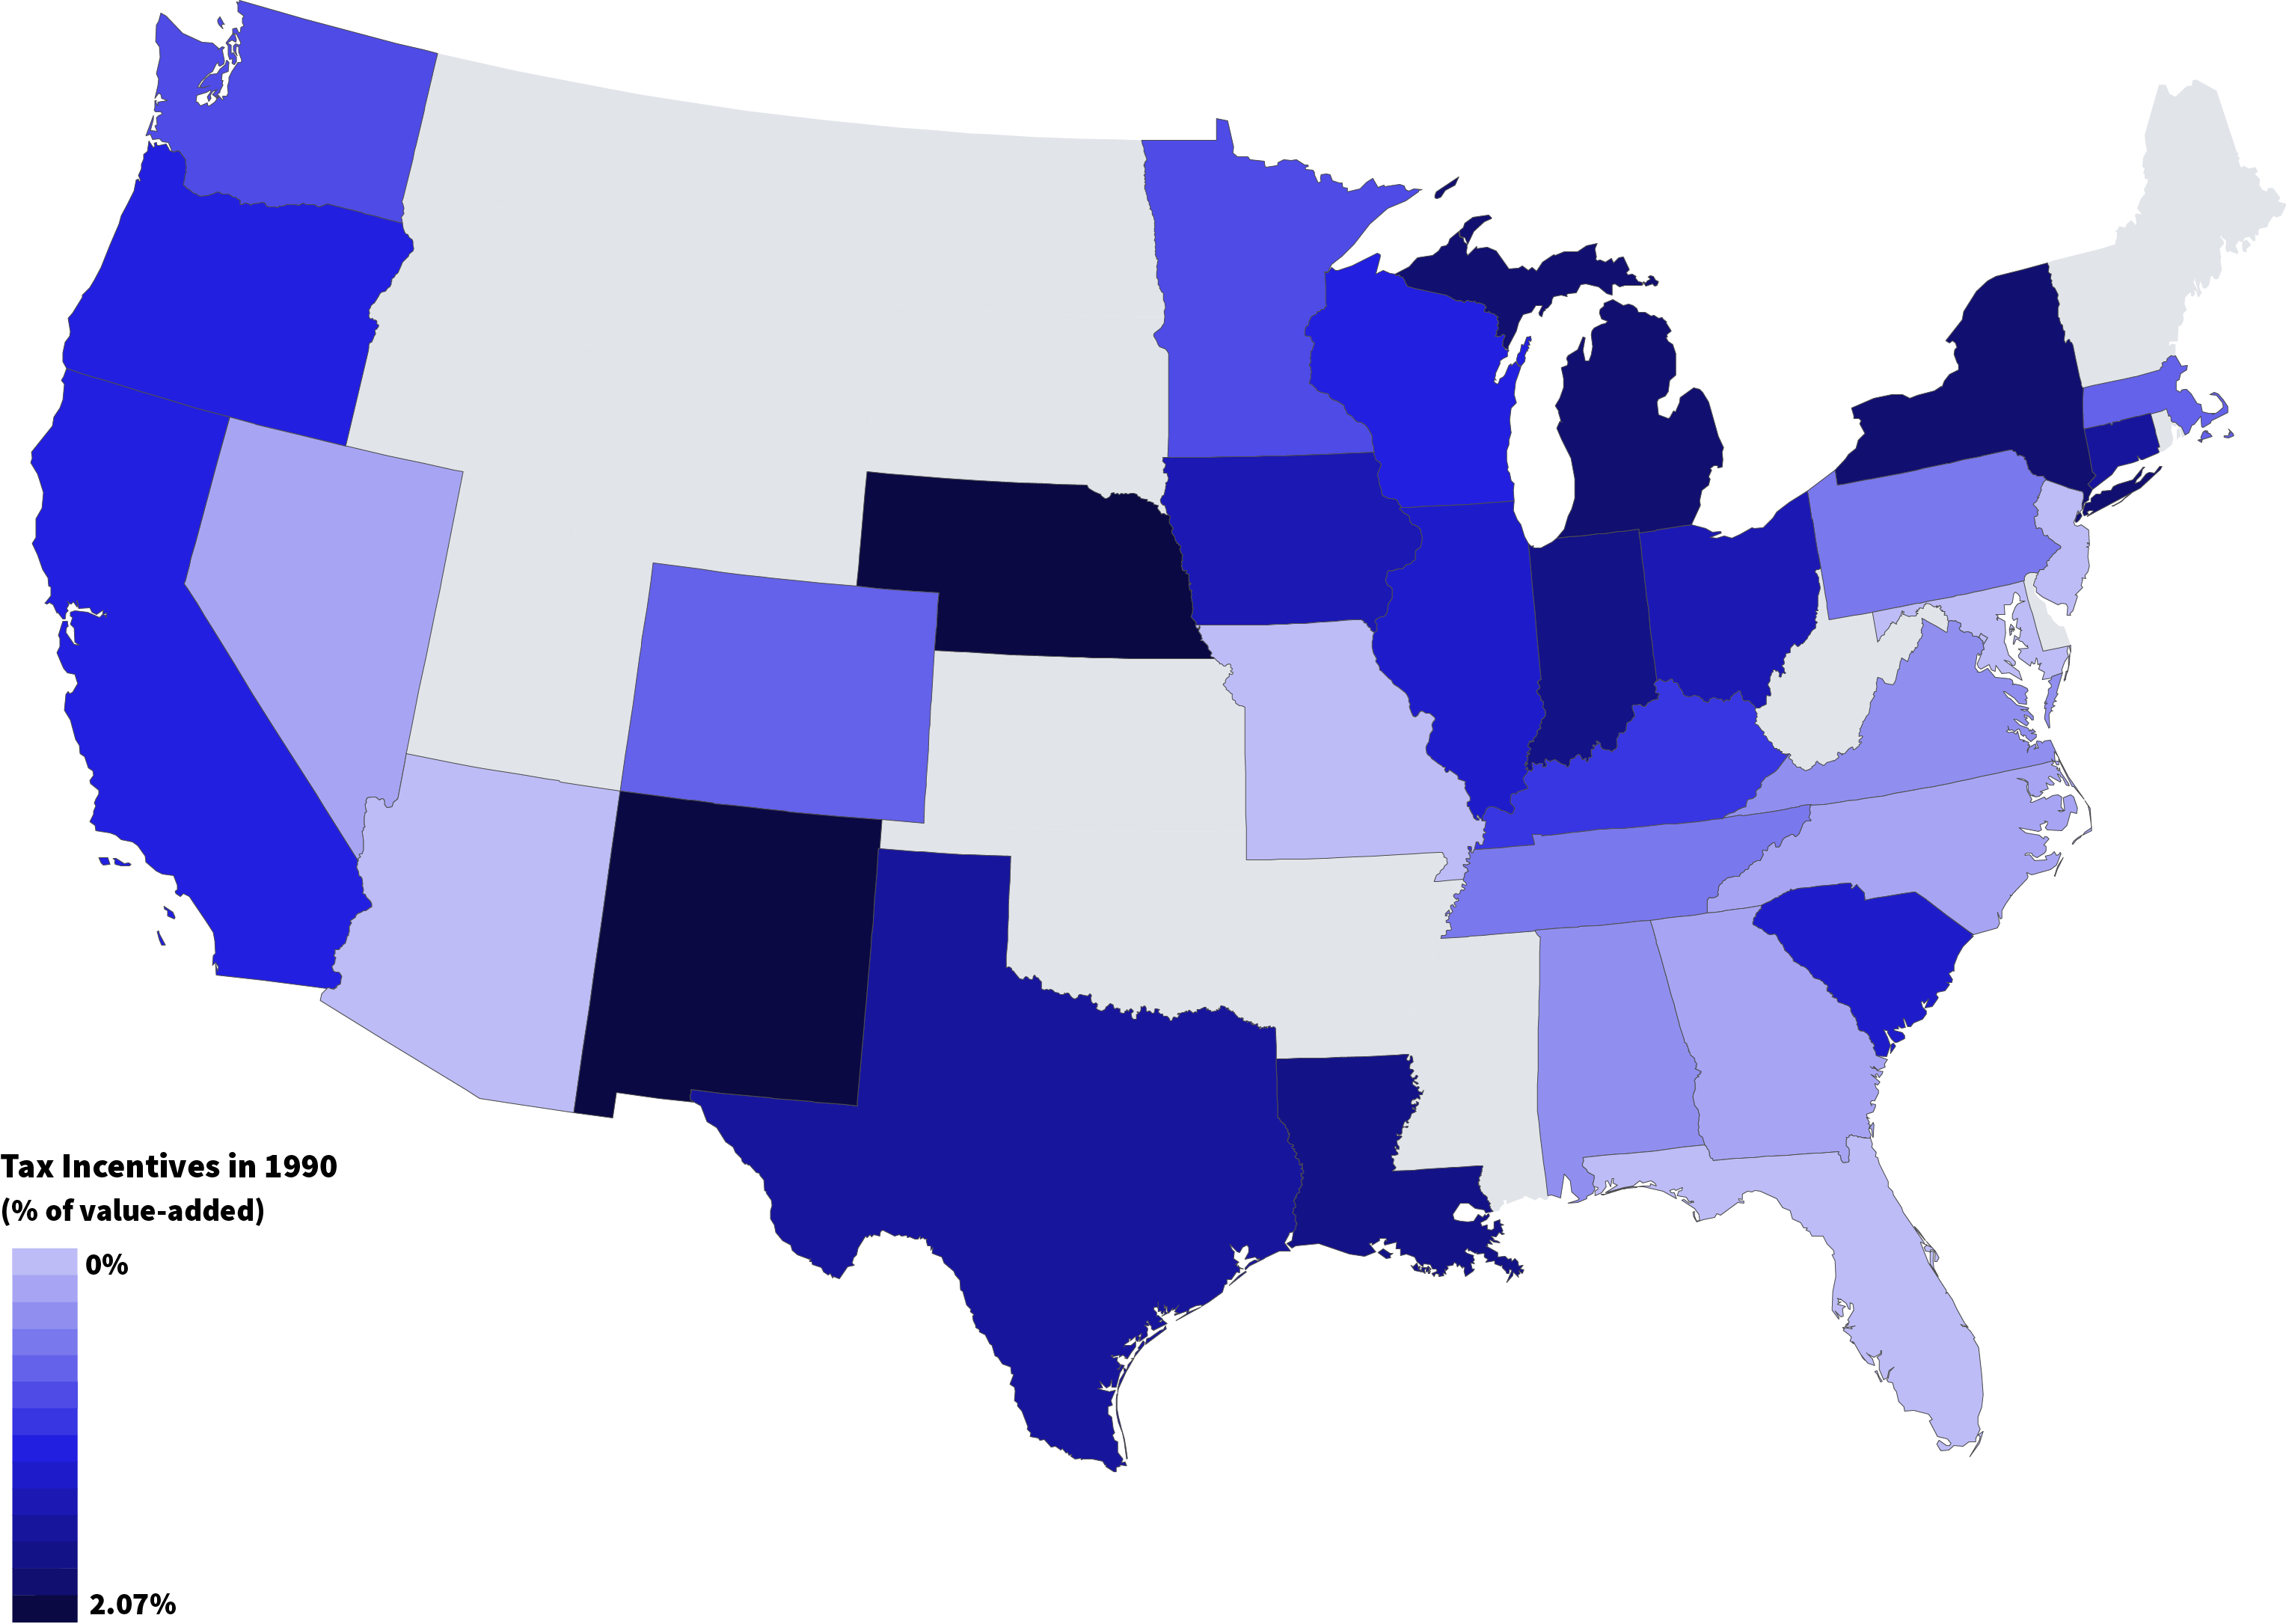
(2) In 1990, only a few states used incentives intensively.
Map Data
Top incentives users in 1990 included Nebraska, New Mexico, Michigan, and New York, whereas many states had little or no use of incentives.
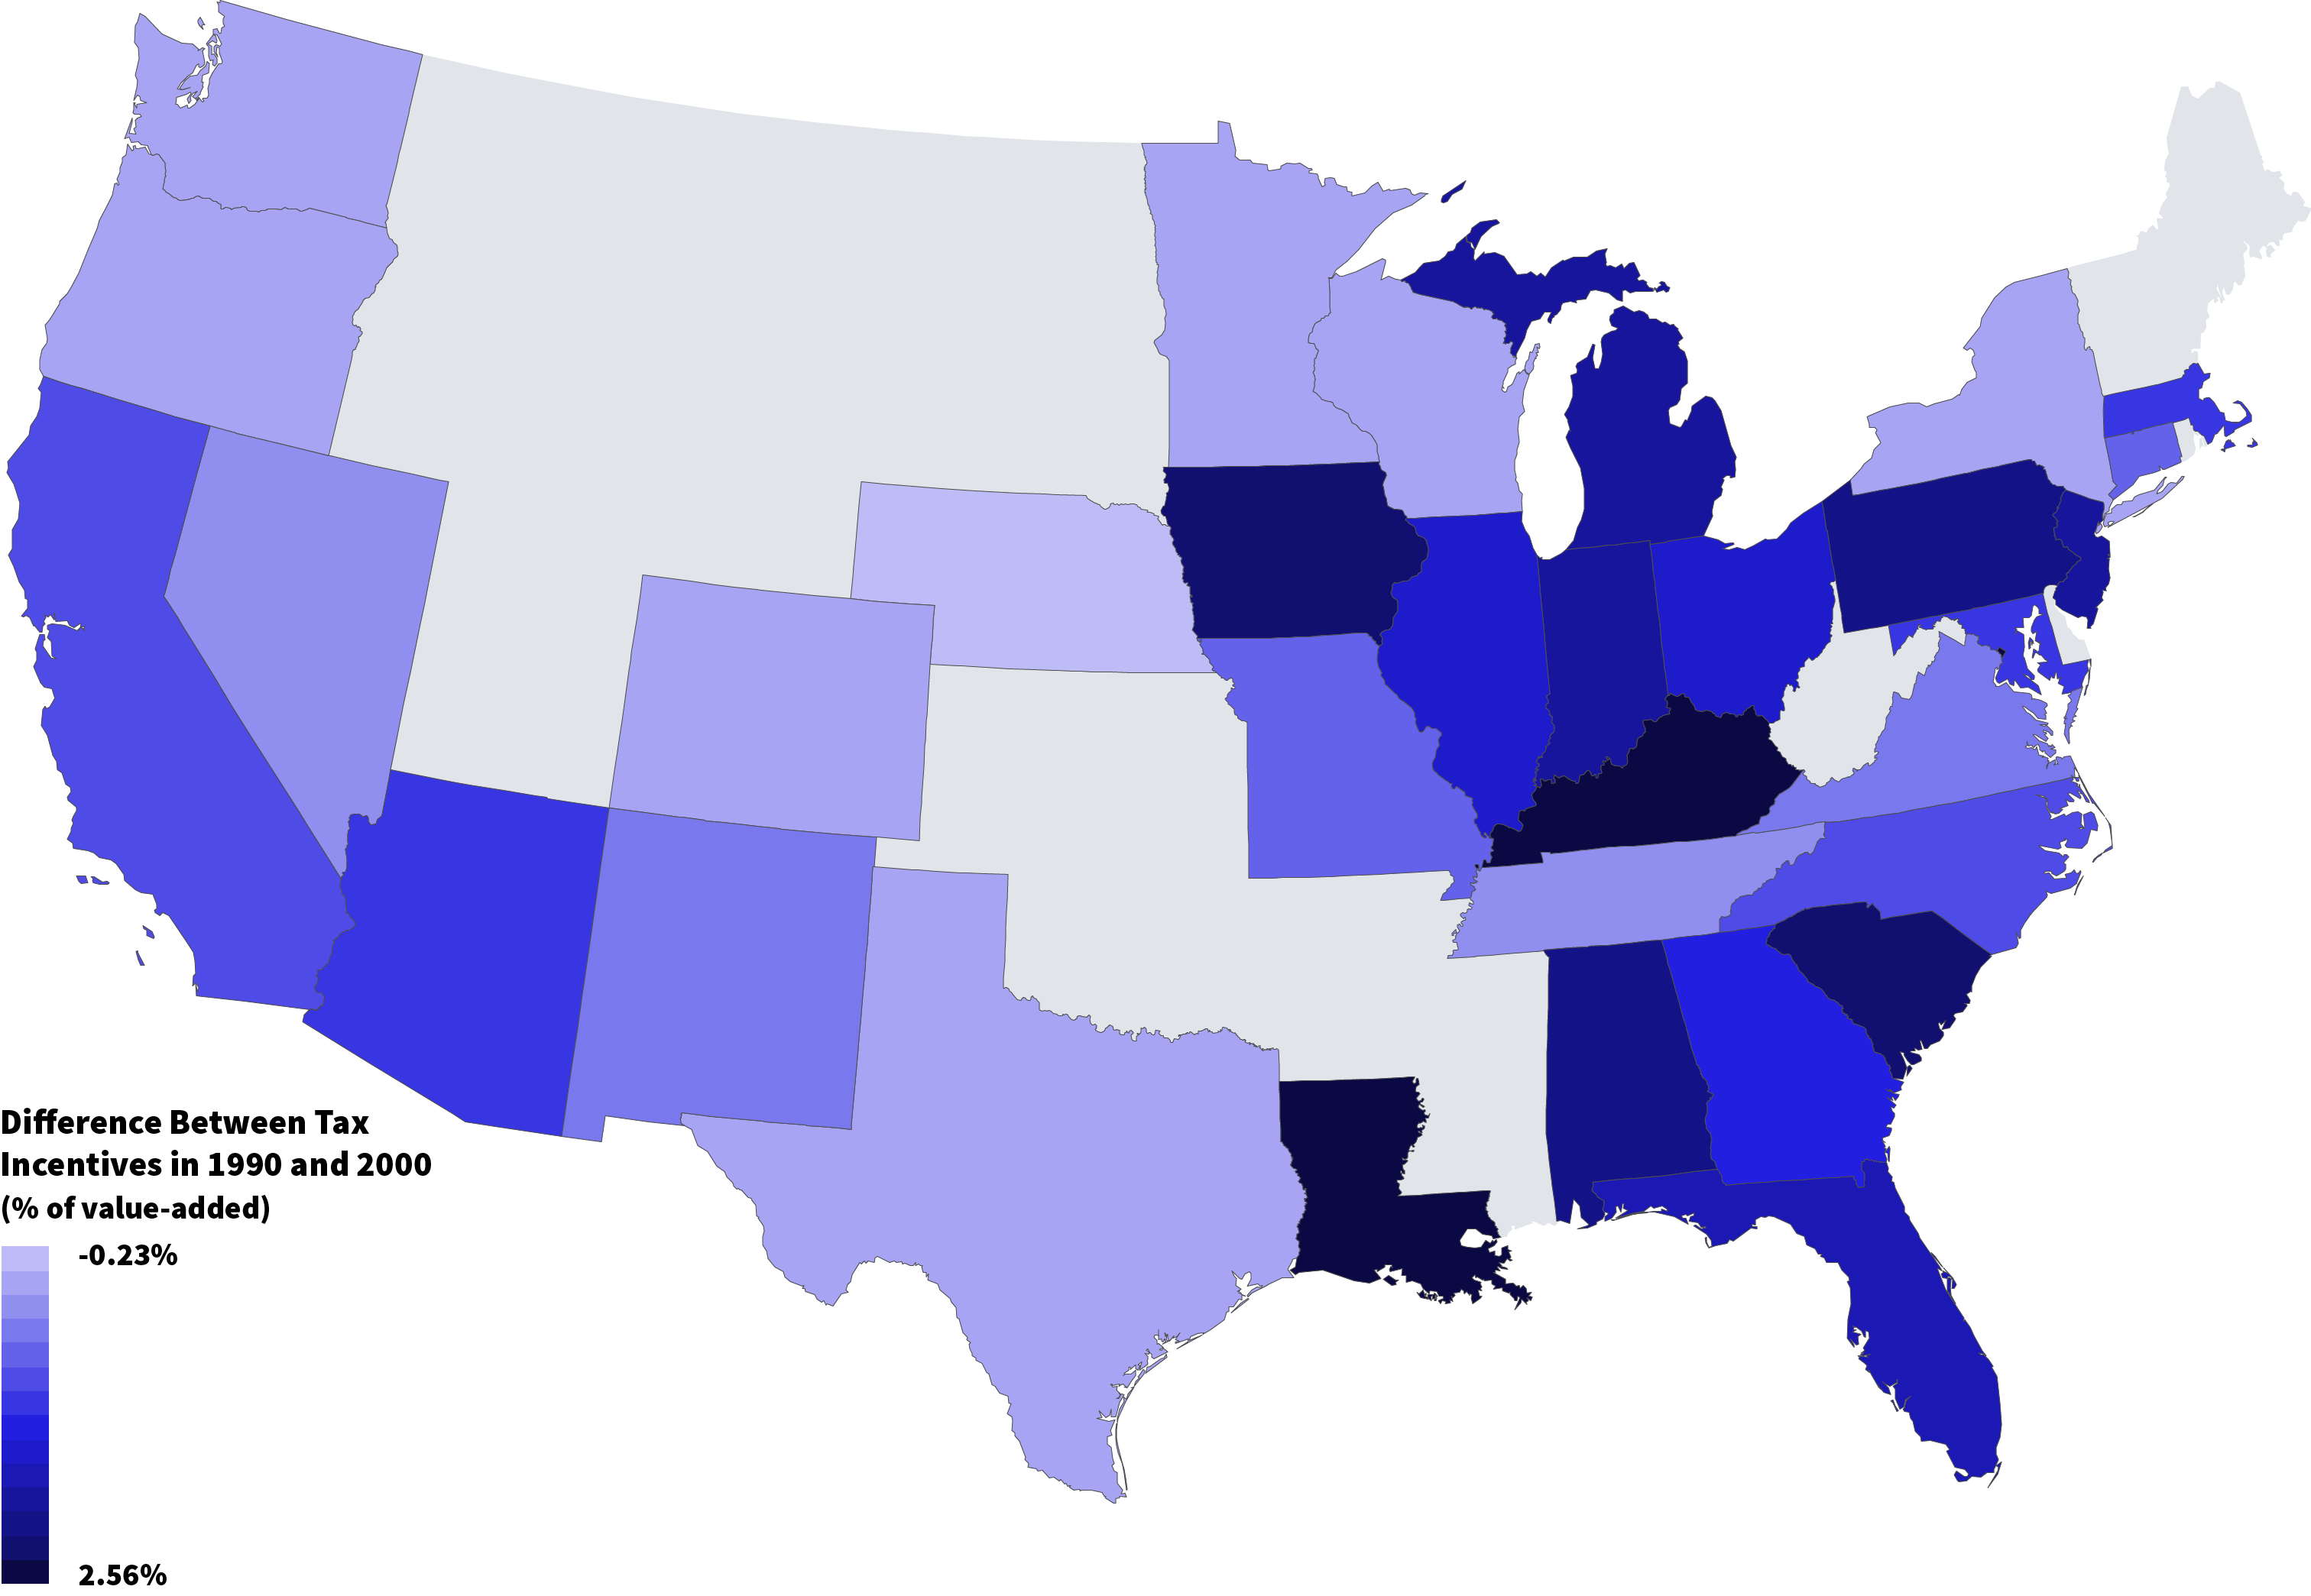
(3) From 1990 to 2000, many states dramatically increased incentives.
Map Data
Eleven states increased their incentives by over 1 percent of business value-added. Such an increase is over 20 percent of state and local business taxes, or over 5 percent of business profits. Put another way, that increase is equivalent to providing a business with an extra incentive of over $1,000 annually per worker for the life of the facility. States that most aggressively increased incentives between 1990 and 2000 included Kentucky, the District of Columbia (counted as a state), Louisiana, Iowa, South Carolina, Pennsylvania, Alabama, New Jersey, Indiana, Michigan, and Florida.
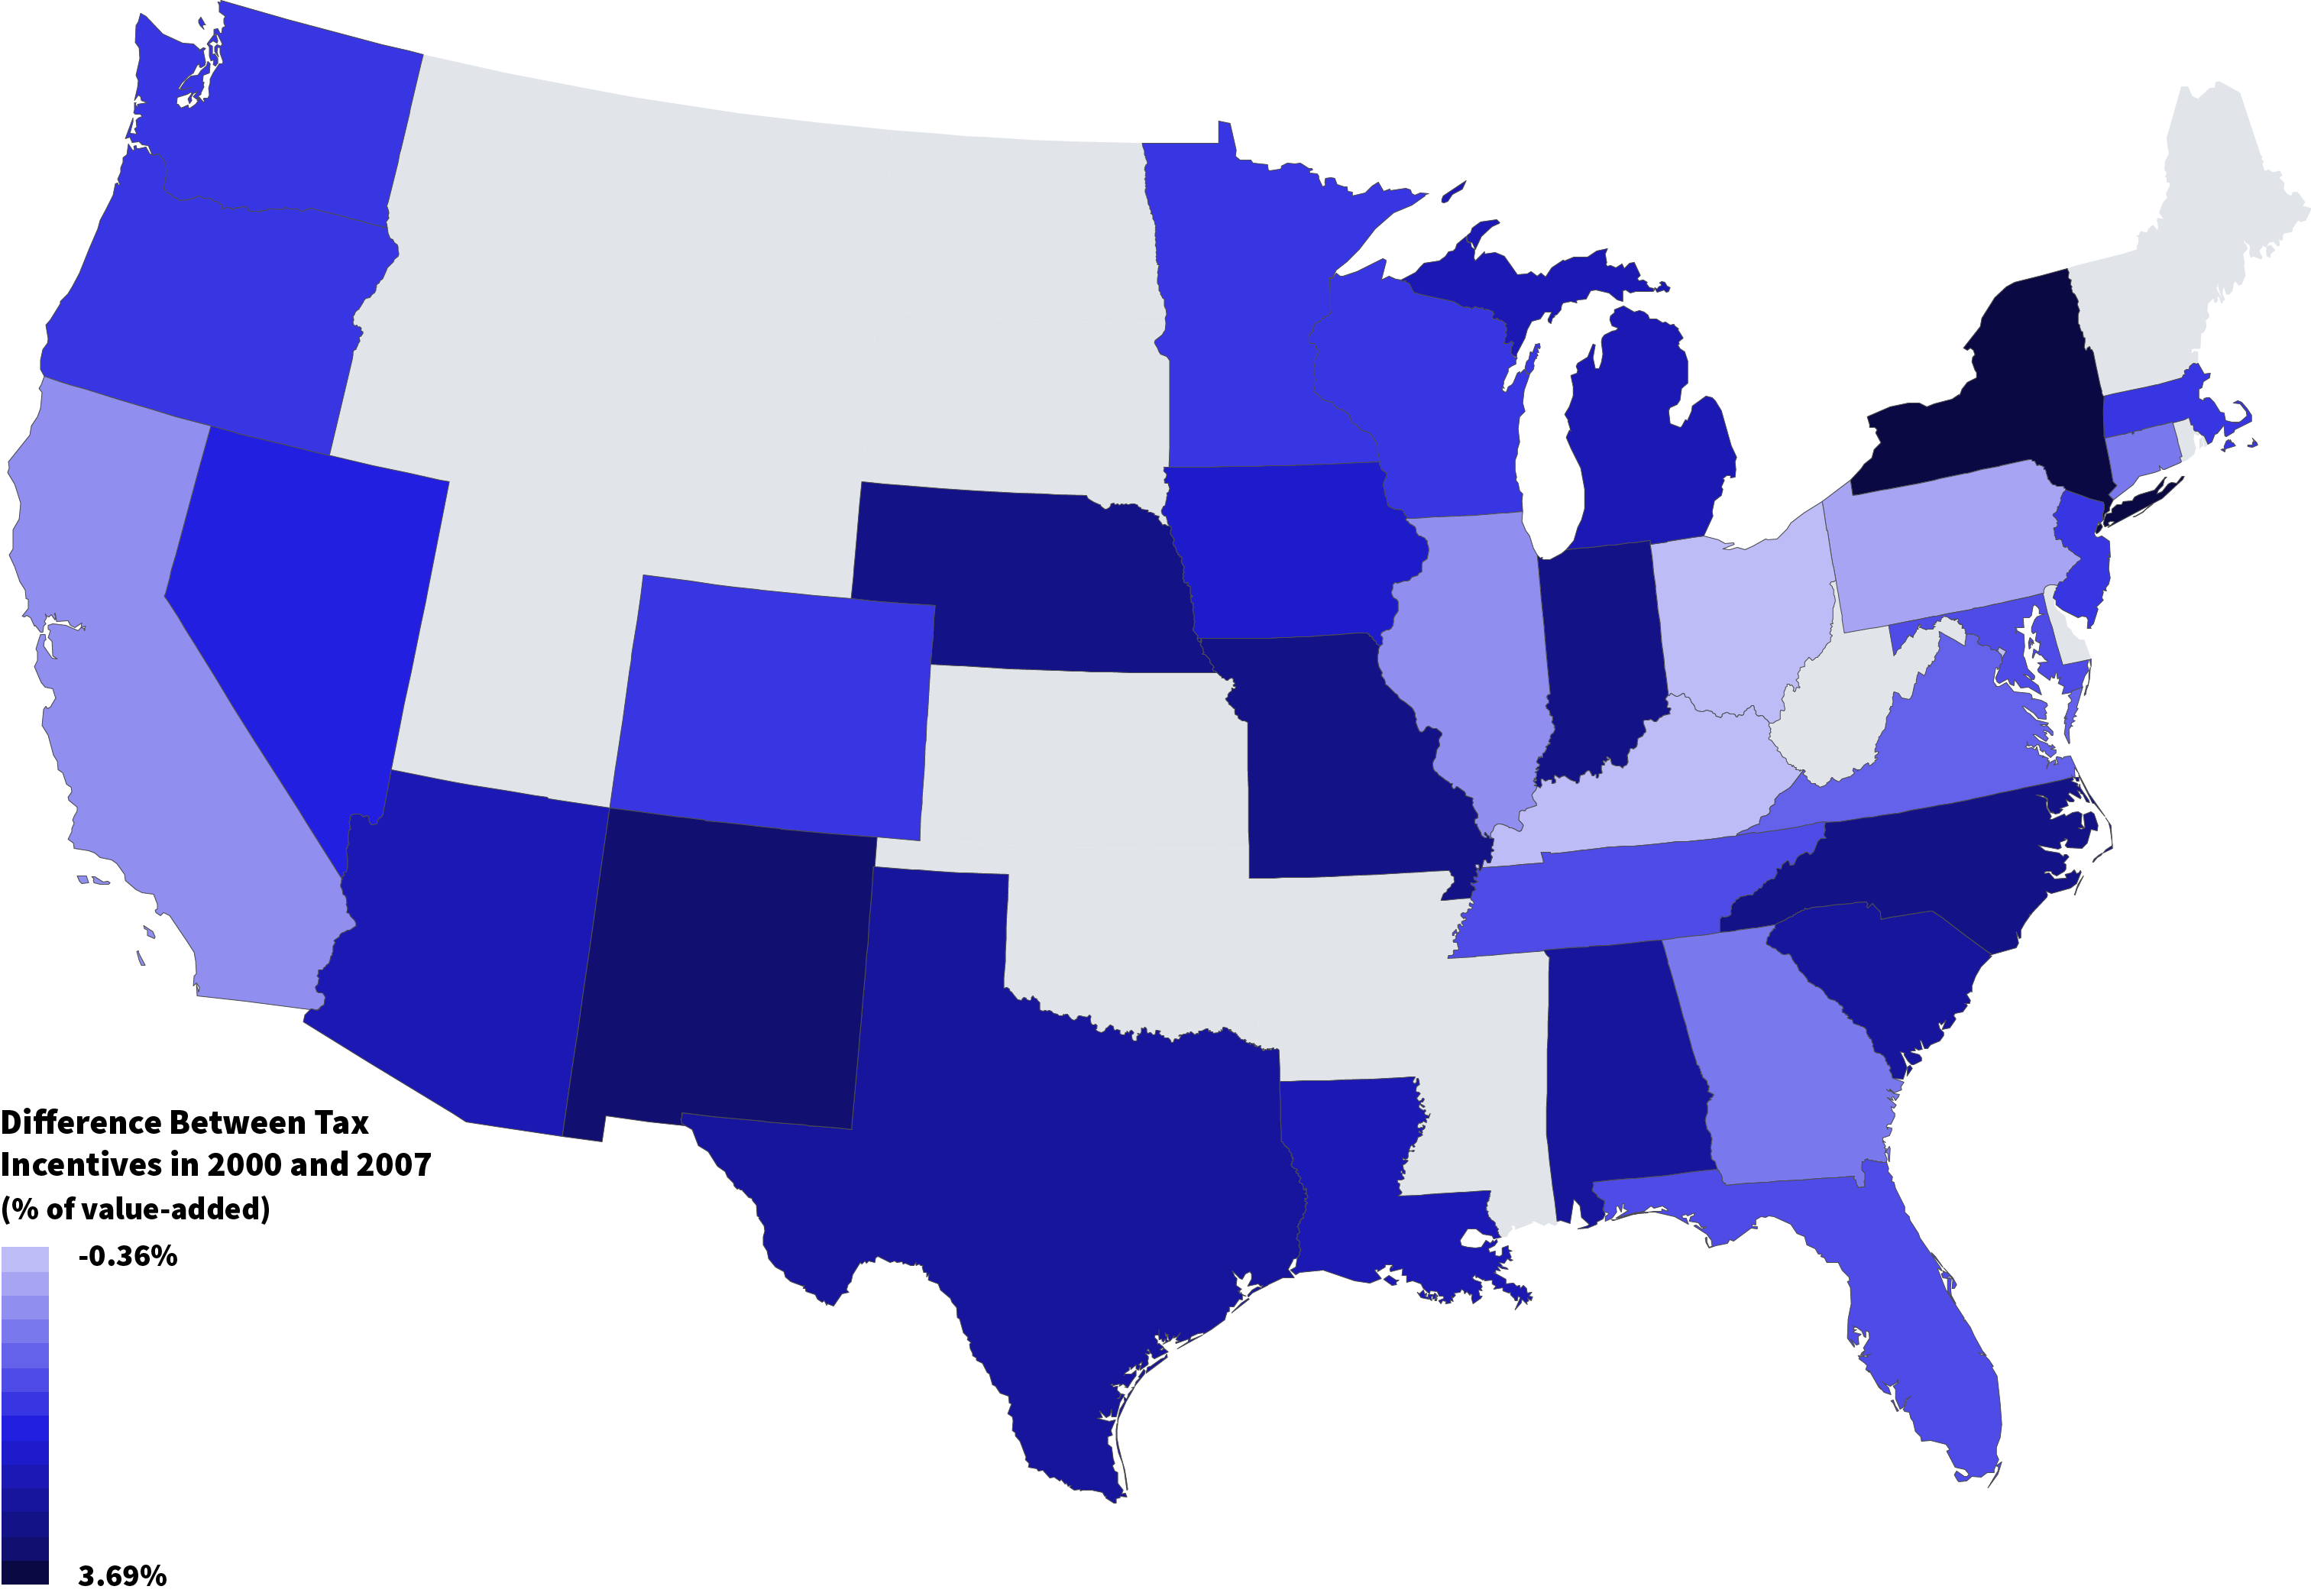
(4) From 2000 to 2007, incentives continued to increase, but at a slower pace.
Map Data
From 2000 until the business cycle peak of 2007, there was continued expansion of incentives. However, the expansion occurred at a slower pace and was more geographically concentrated than in the previous period. Among states that most aggressively expanded incentives were New York, New Mexico, and Missouri. Some states in this period made modest cutbacks in incentives.
(5) From 2007 to 2015, incentives went up in some states but down in others.
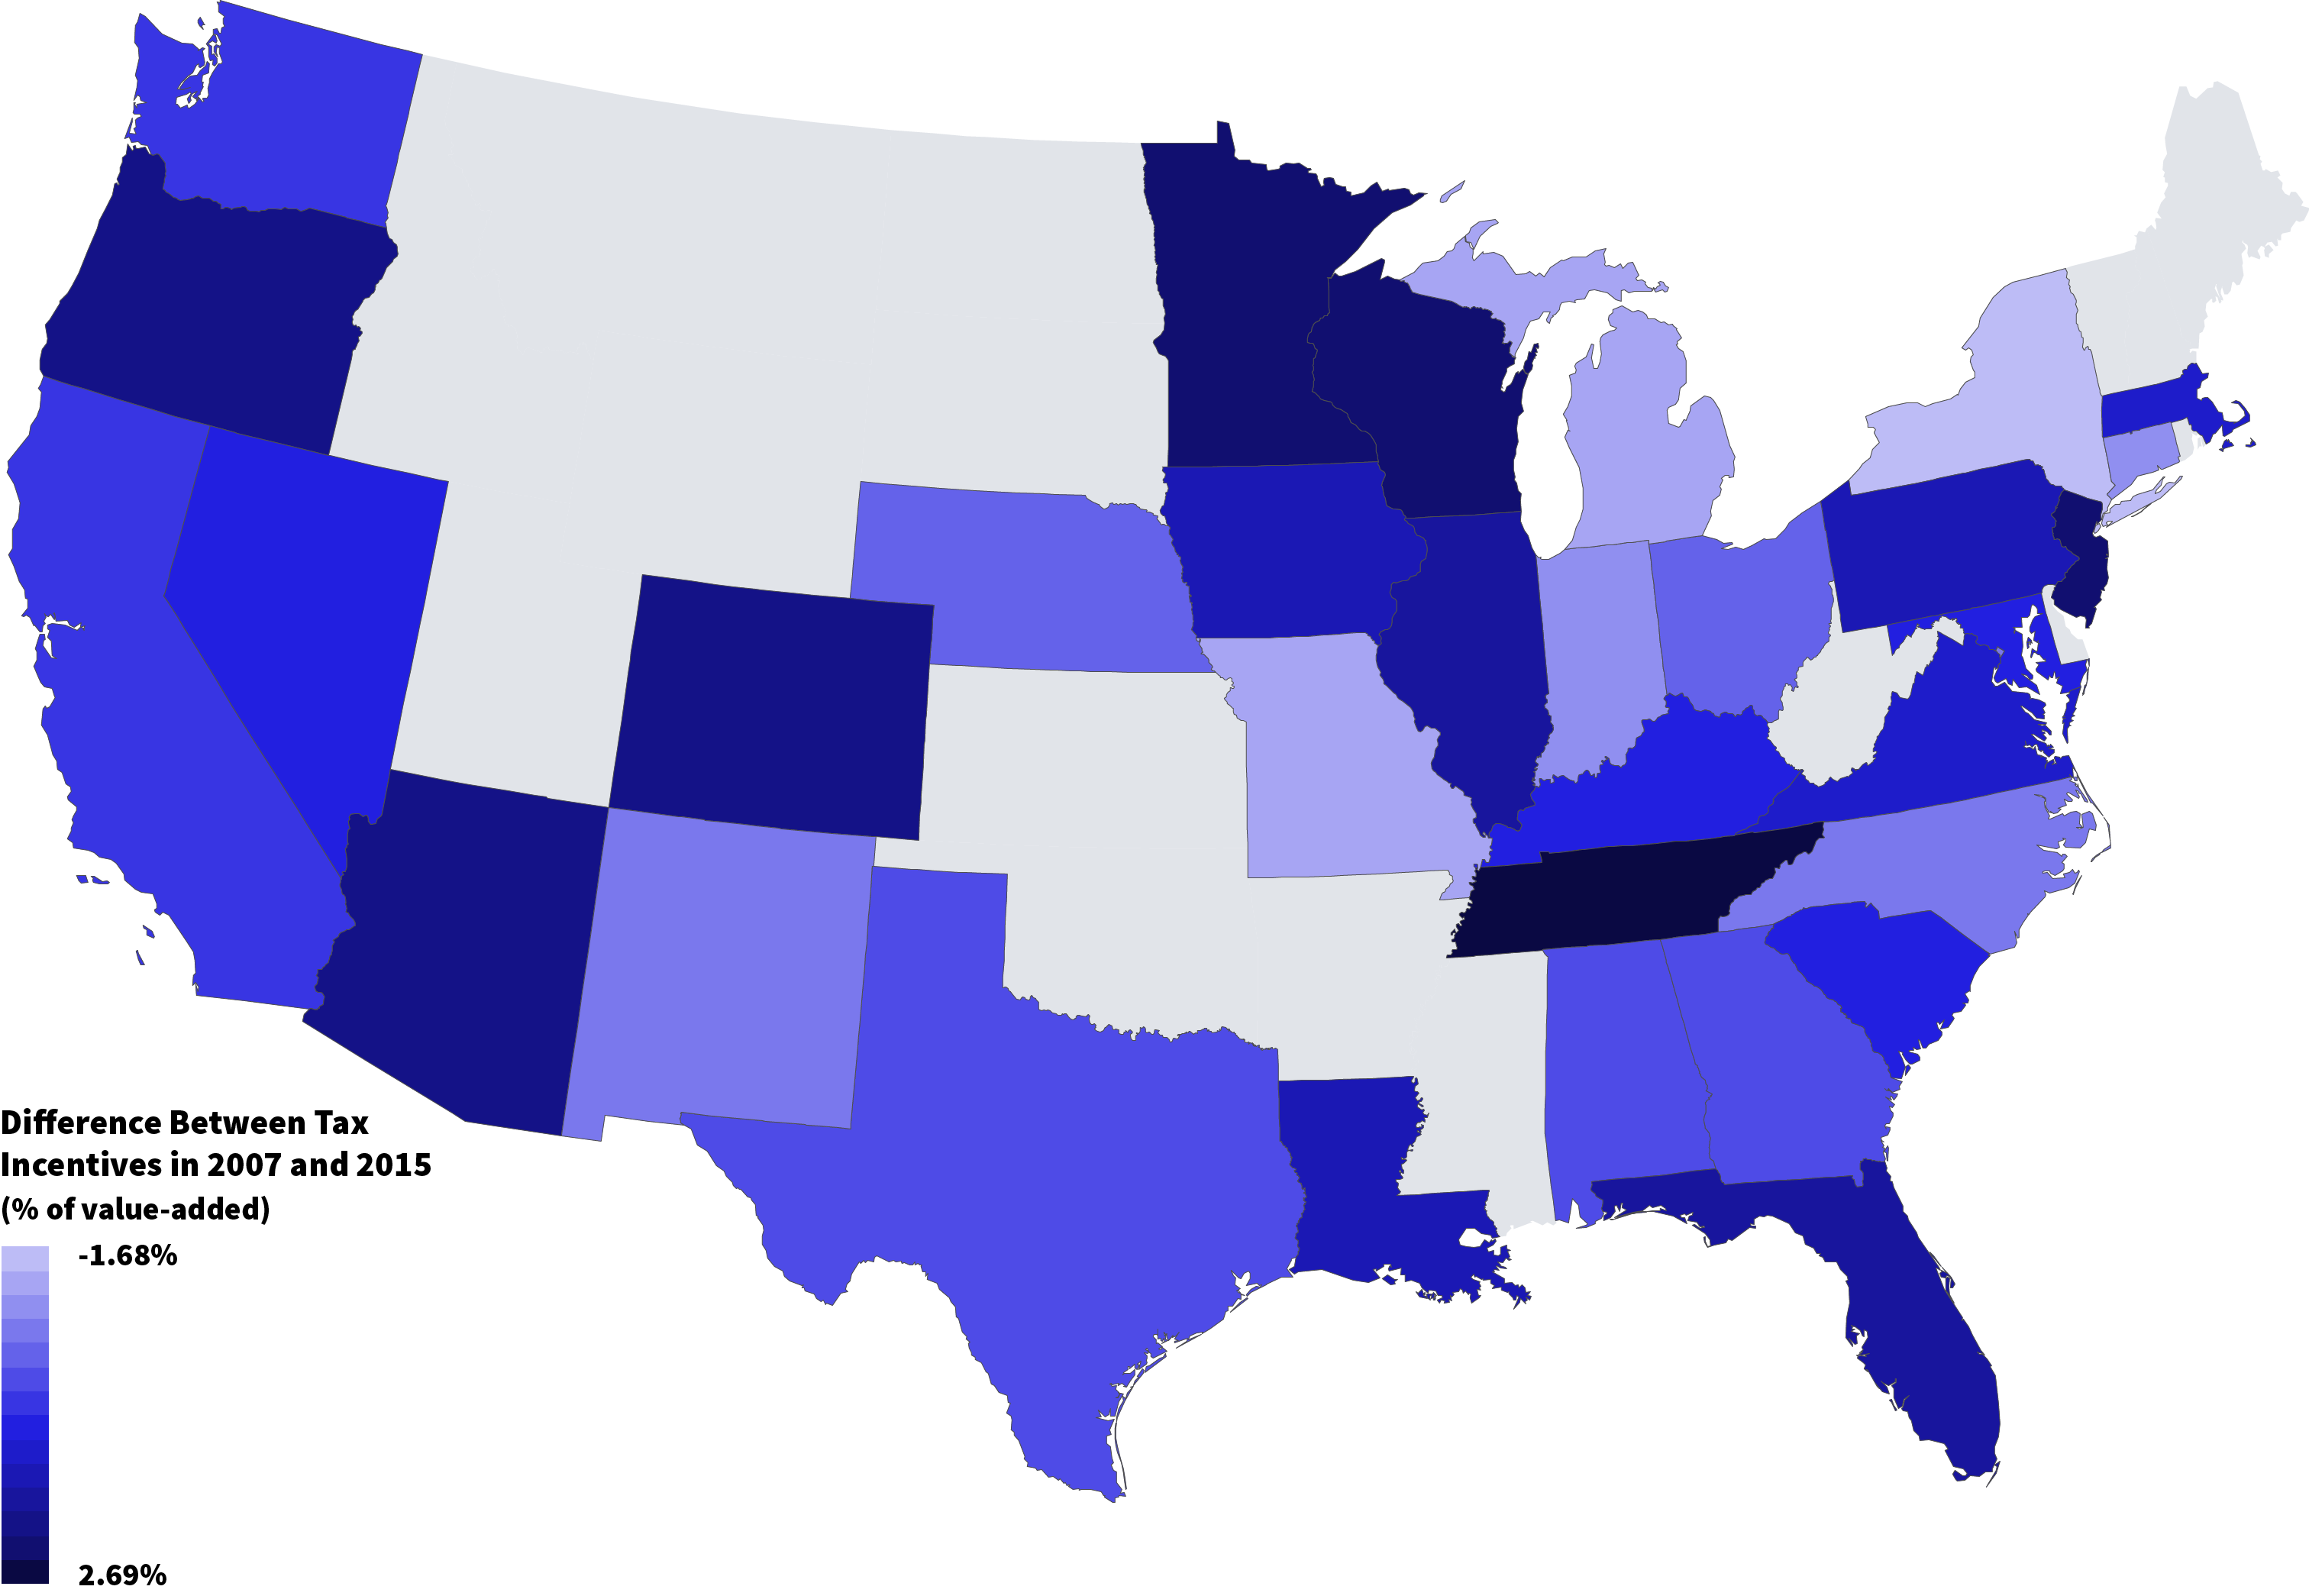
Map Data
Overall, national incentives did not increase during this period. However, some states dramatically expanded incentives while others made large cutbacks. Among states that dramatically expanded incentives from 2007 until 2015 were Tennessee, New Jersey, Wisconsin, and Minnesota. Tennessee, Wisconsin, and Minnesota had previously been relatively minor incentive players. New York and Michigan were among the states that made dramatic cutbacks in incentives.
(6) As of 2015, incentives are used extensively in many states, but wide variation across states remains.
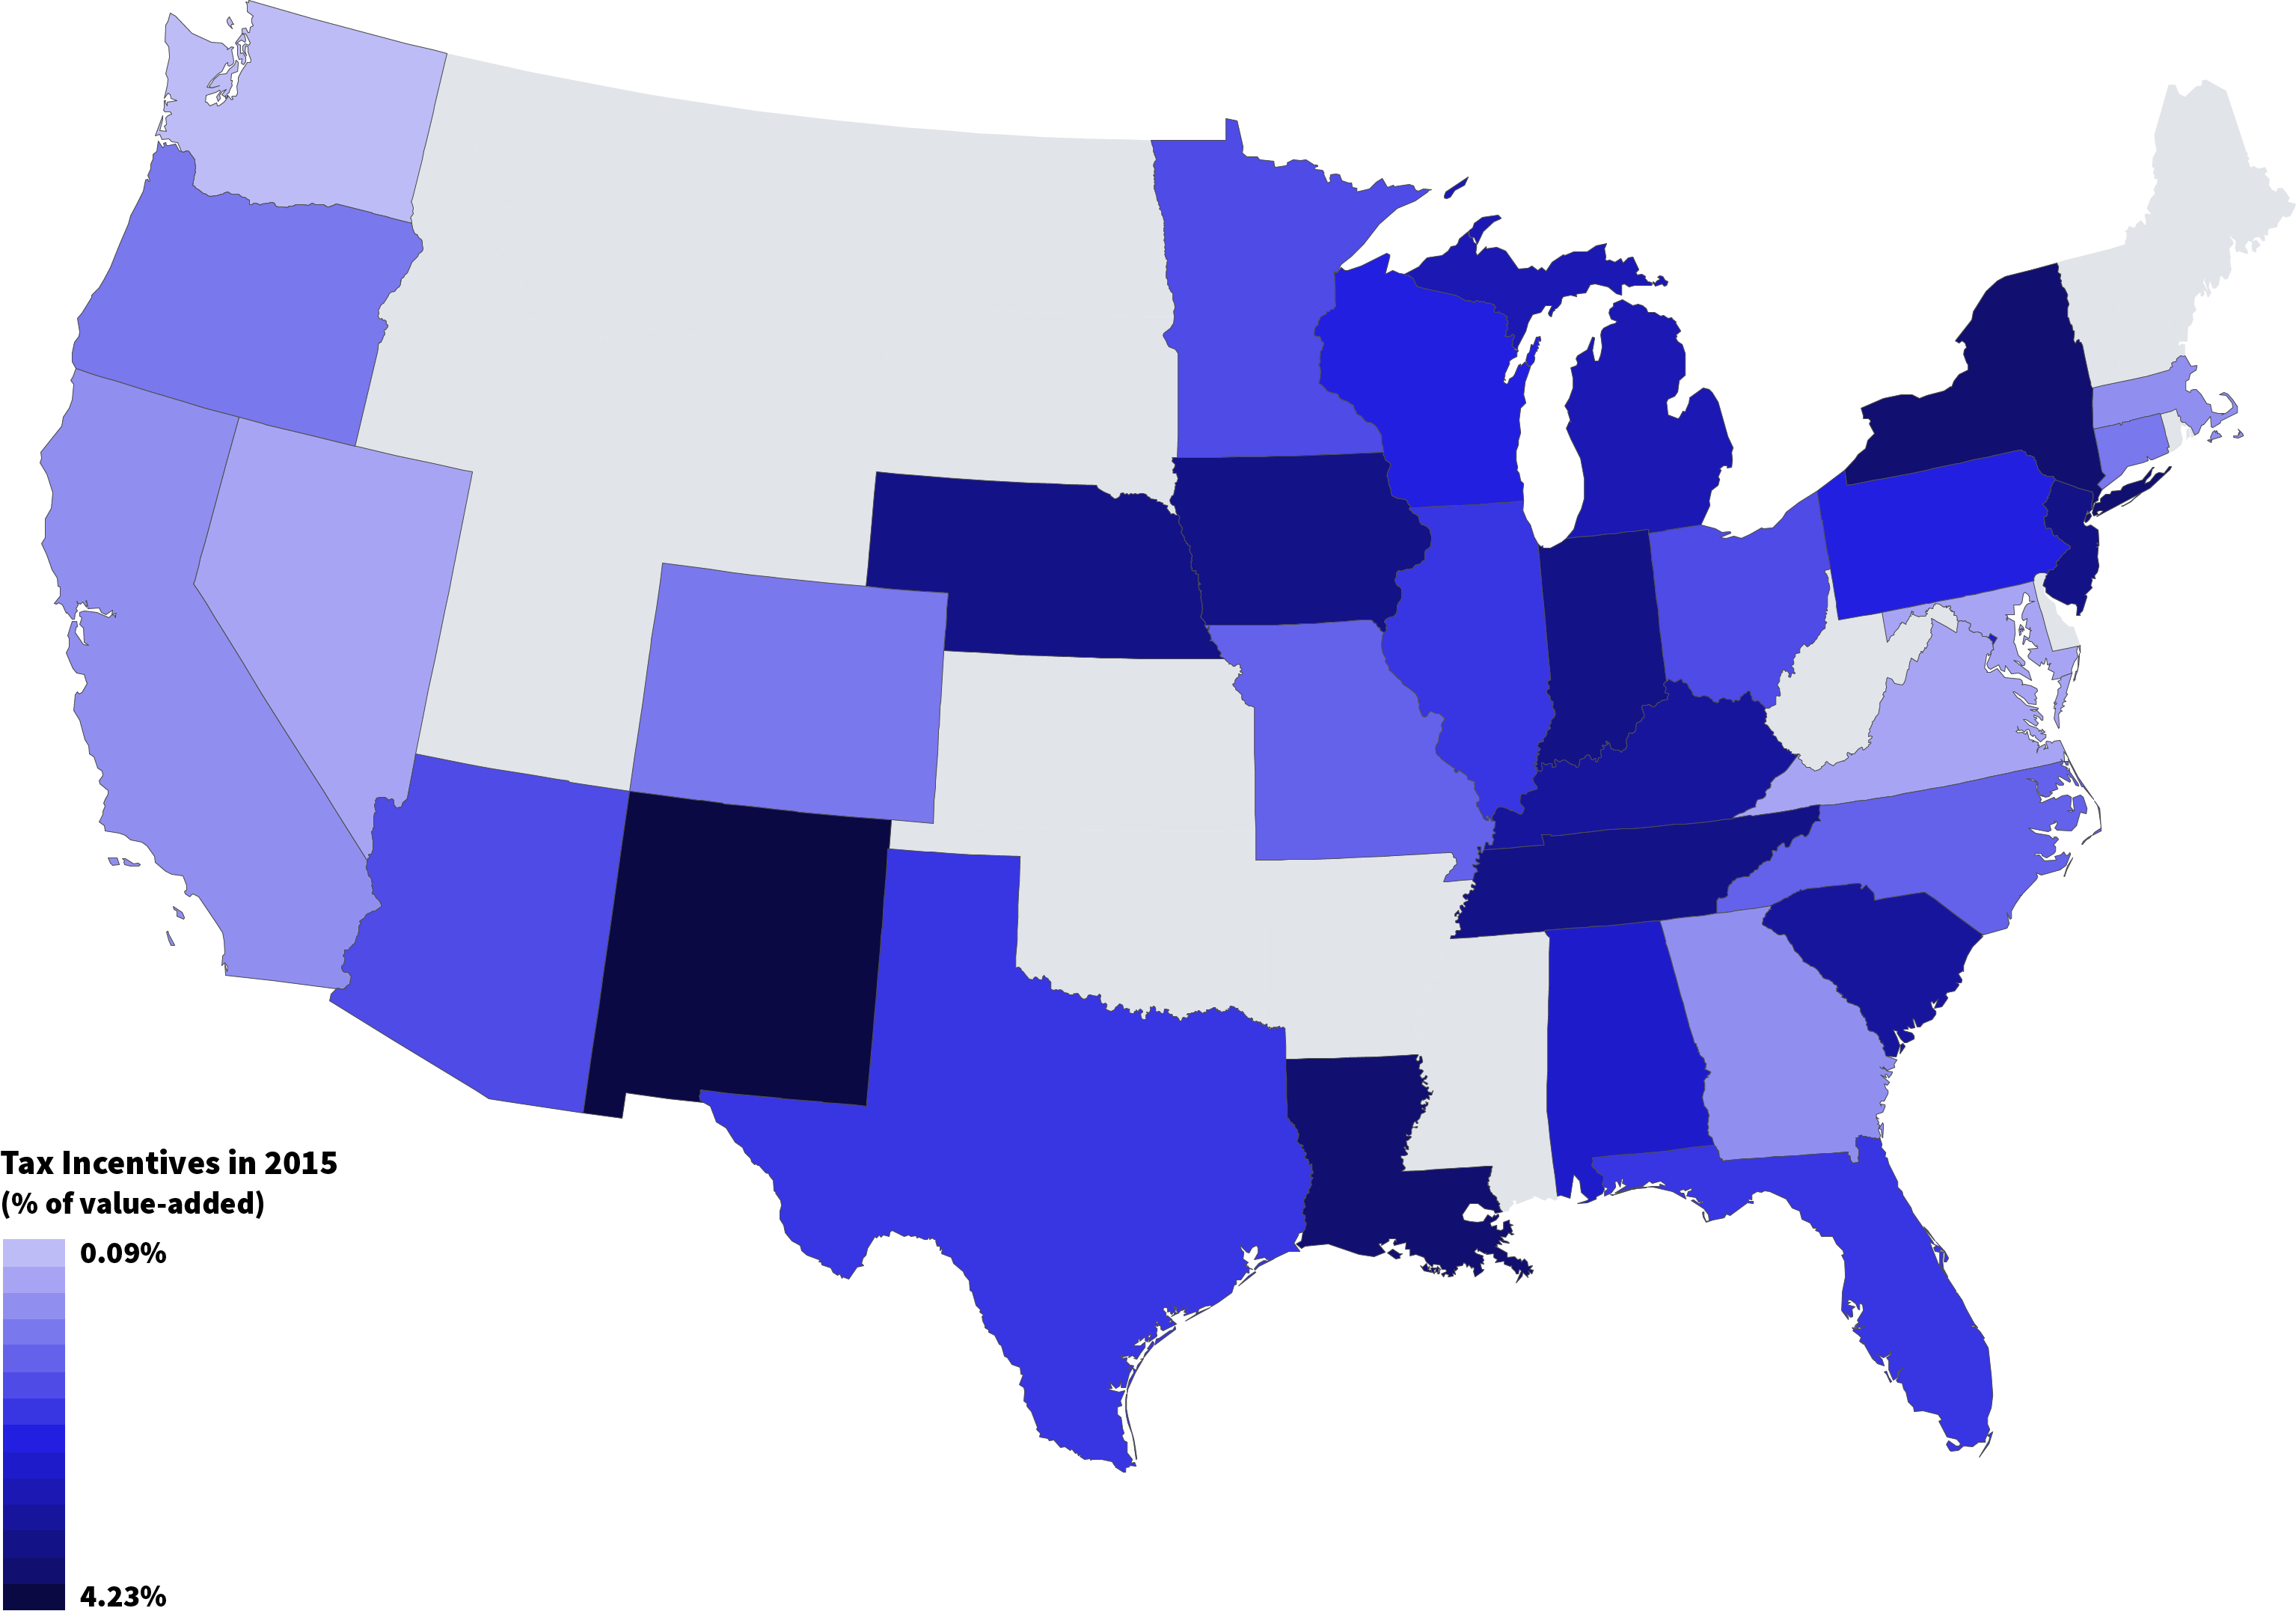
Map Data
Several states' use of incentives amounted to over 3 percent of value-added, or over $3,000 per worker per year for the life of the business, including New Mexico, New York, and Louisiana. Many other states' incentives were over 2 percent of value-added, or over $2,000 per worker, including Tennessee, New Jersey, Indiana, Iowa, Nebraska, South Carolina, Kentucky, and Michigan. On the other hand, some states still have only small incentives, including Washington State, Nevada, Virginia, Maryland, and California.
(7) As of 2015, incentives in many states are not well-targeted on industries that create more jobs.
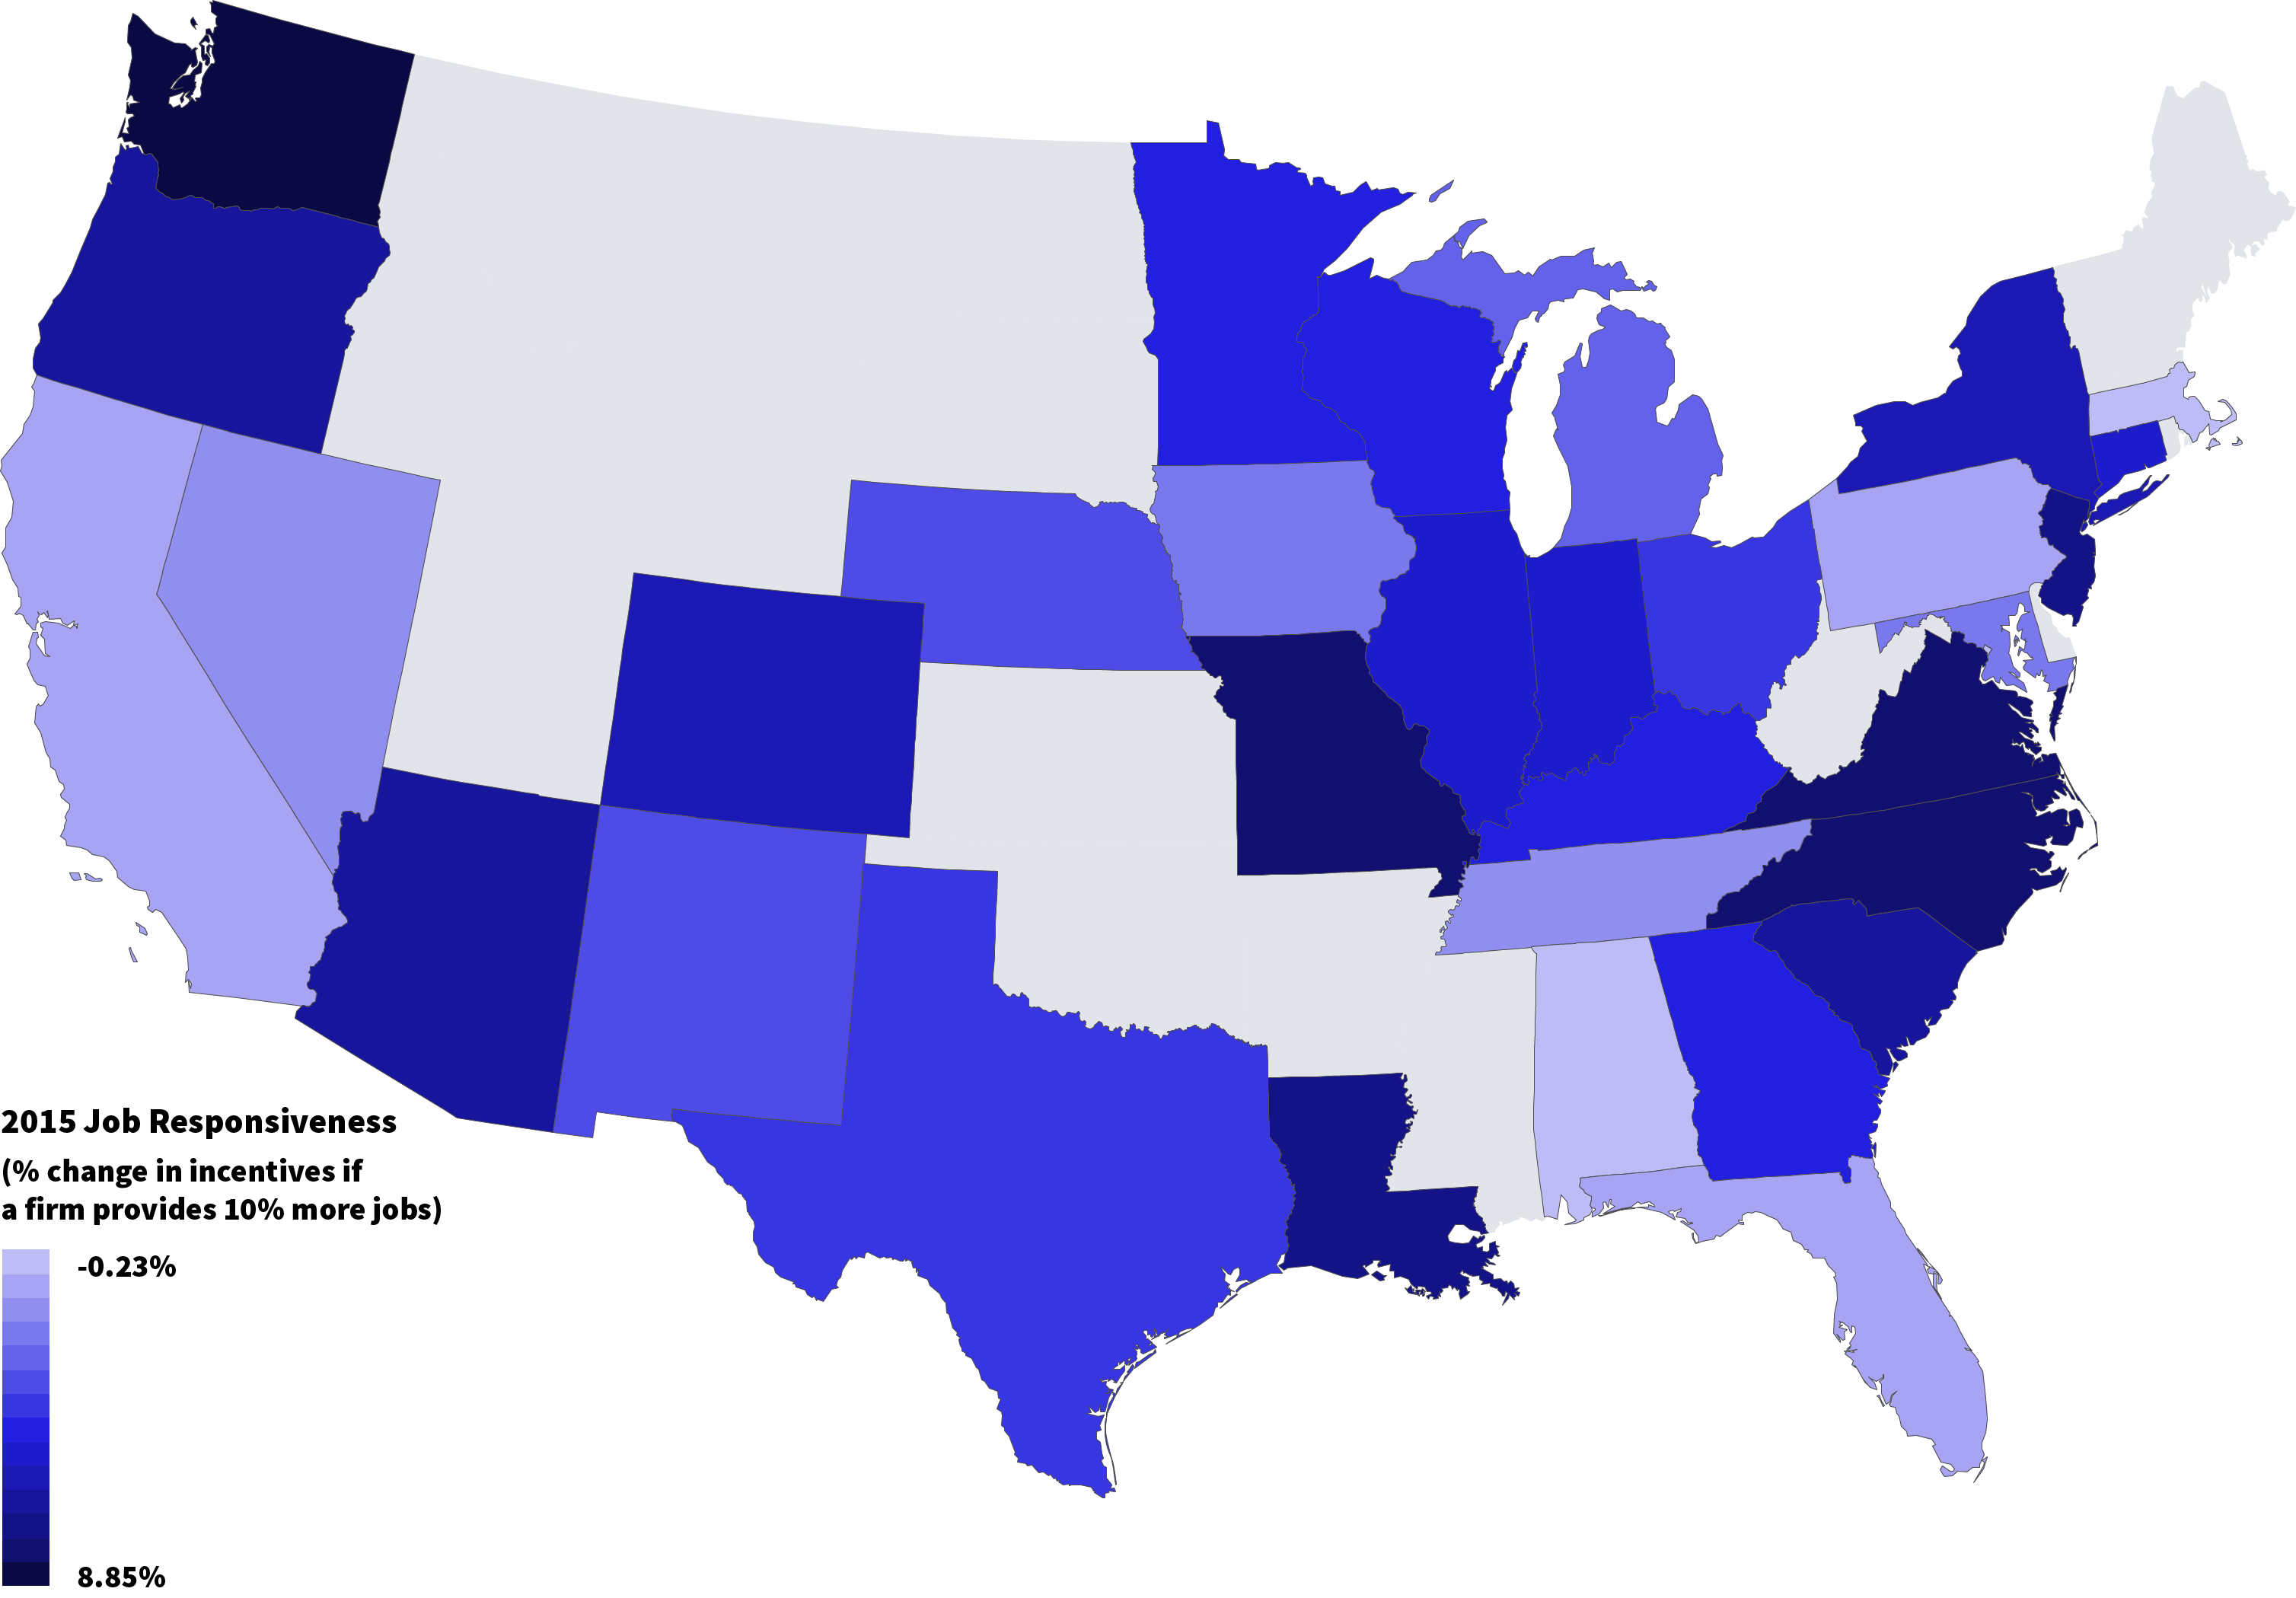
Map Data
A question often asked about incentives is, "Are they well-designed?" A primary purpose of incentives is to increase jobs. We looked at how incentives across industry varied with the jobs provided. Holding wage rates constant, incentives on average were not very sensitive to how many jobs were provided. In the nation as a whole, a 10 percent increase in jobs provided only increased incentive awards by 3.7 percent. In some states, the amount of incentives provided had almost nothing to do with the number of jobs created, including Massachusetts, the District of Columbia, Alabama, Florida, California, and Pennsylvania. States in which incentives were very responsive to jobs included Washington, Missouri, North Carolina, and Virginia.
(8) Incentives are not well targeted on industries that pay higher wages.
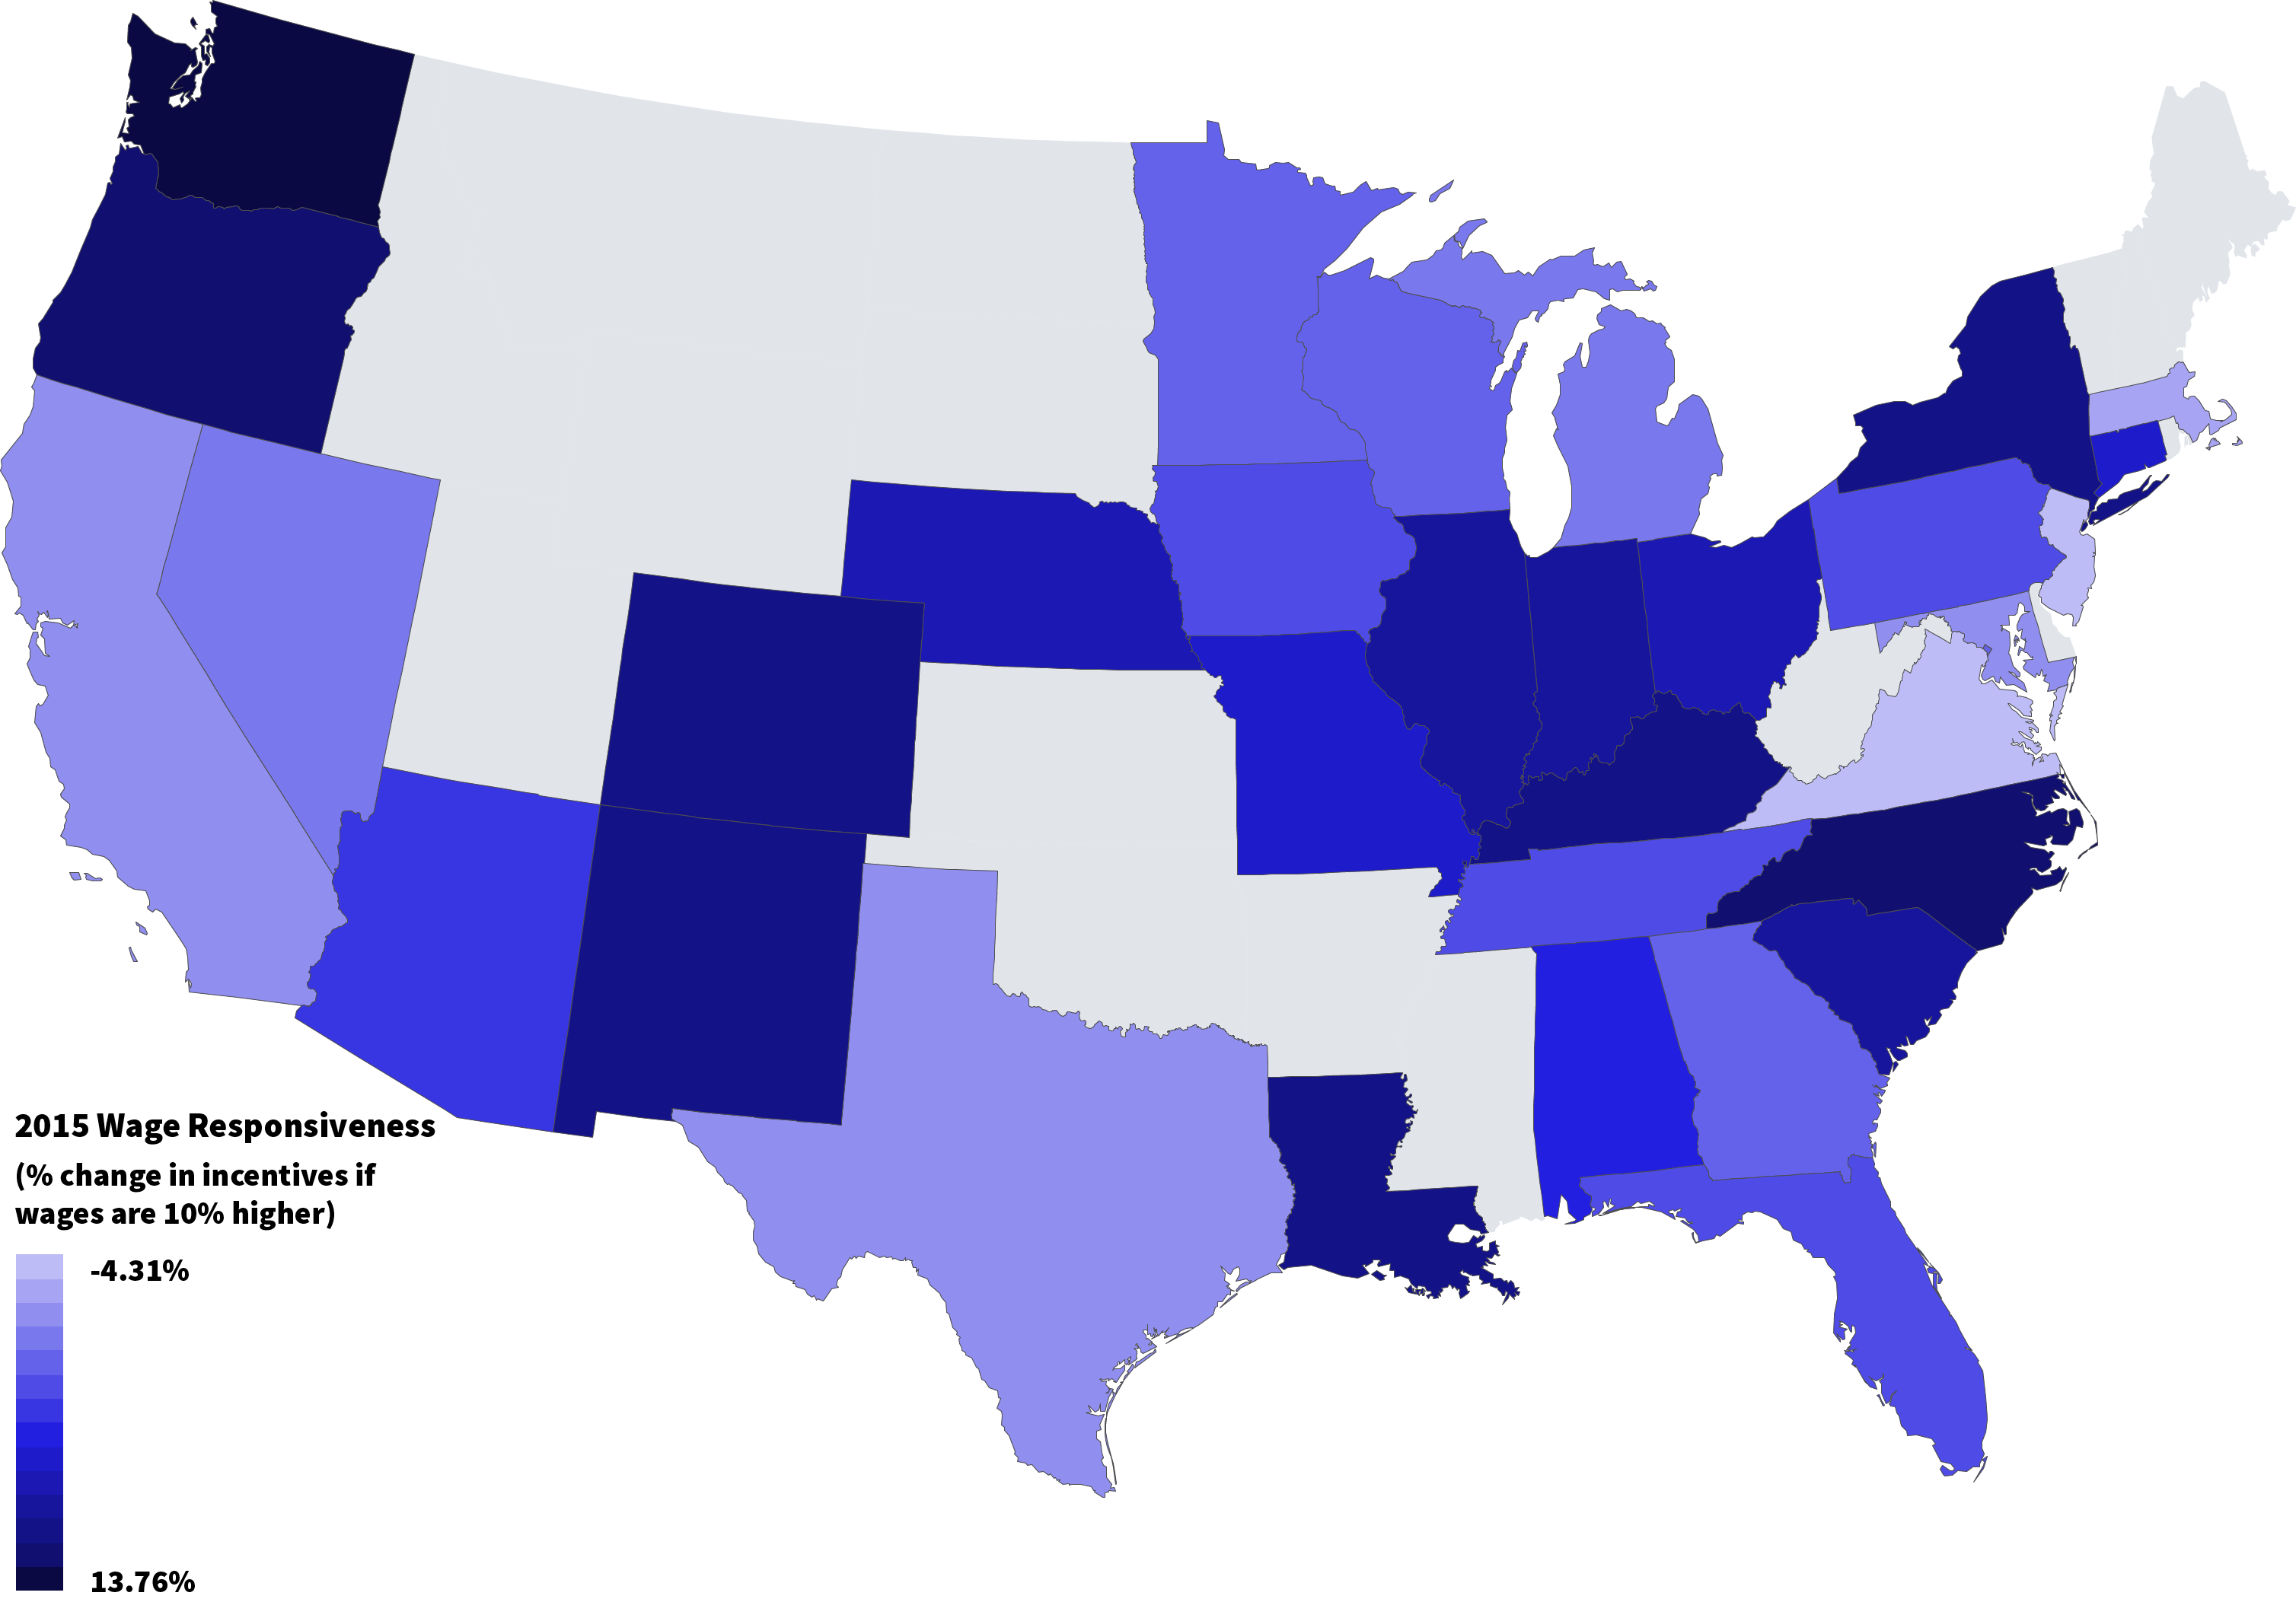
Map Data
We might also want incentives to be higher if a firm offers higher wages. Yet, on average, if jobs offer 10 percent higher wages, incentives only increase by 2.7 percent. In 12 states, incentives actually tend to be lower for high-wage firms and higher for low-wage firms. These 12 states include Virginia, New Jersey, Massachusetts, Maryland, California, Texas, Michigan, Nevada, Minnesota, Wisconsin, Georgia, and the District of Columbia. On the other hand, in some states incentives go up more than 7 percent for a 10 percent increase in wages, including in North Carolina, Oregon, and Washington.
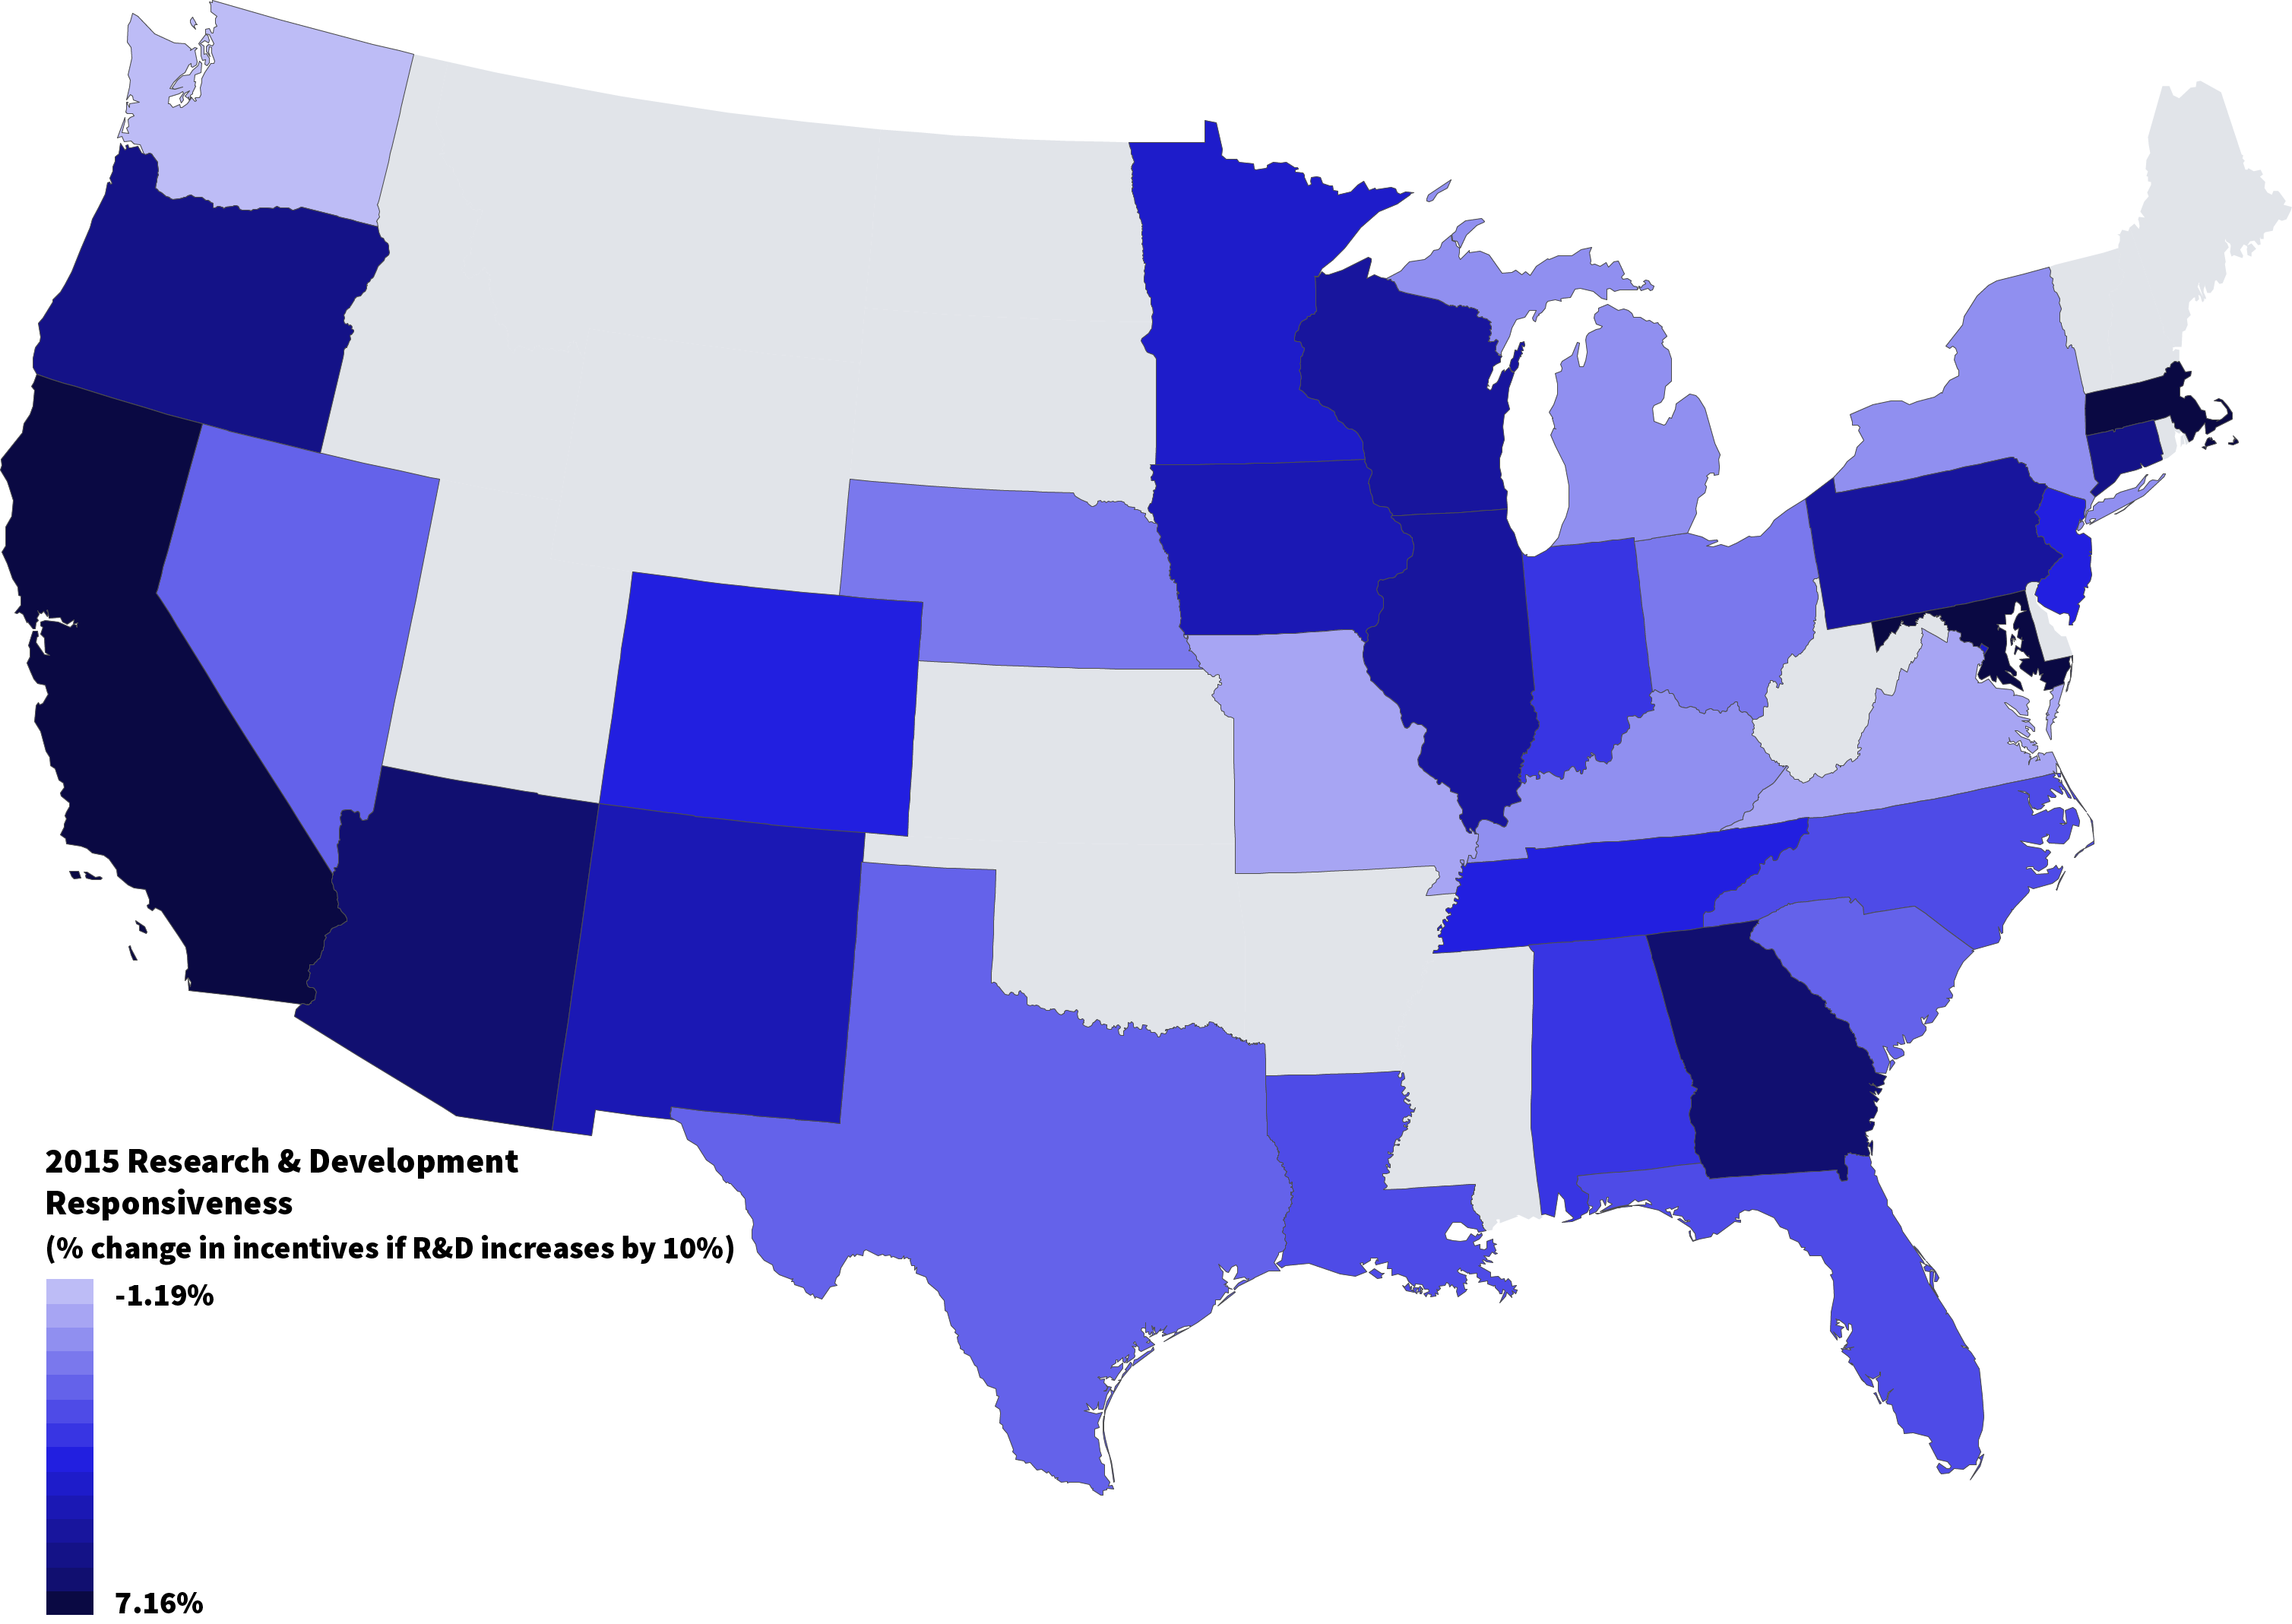
(9) Incentives are not well-targeted on industries with higher research spending.
Map Data
Incentives also might be plausibly targeted at firms that do a lot of R&D, as that would be expected to create many spin-offs for the local economy, helping to build high-tech clusters. On average and for most states, however, incentives appear to have little to do with a firm's R&D. Some exceptions are a few states in which incentives do increase quite a bit with R&D, including California, Maryland, and Massachusetts.
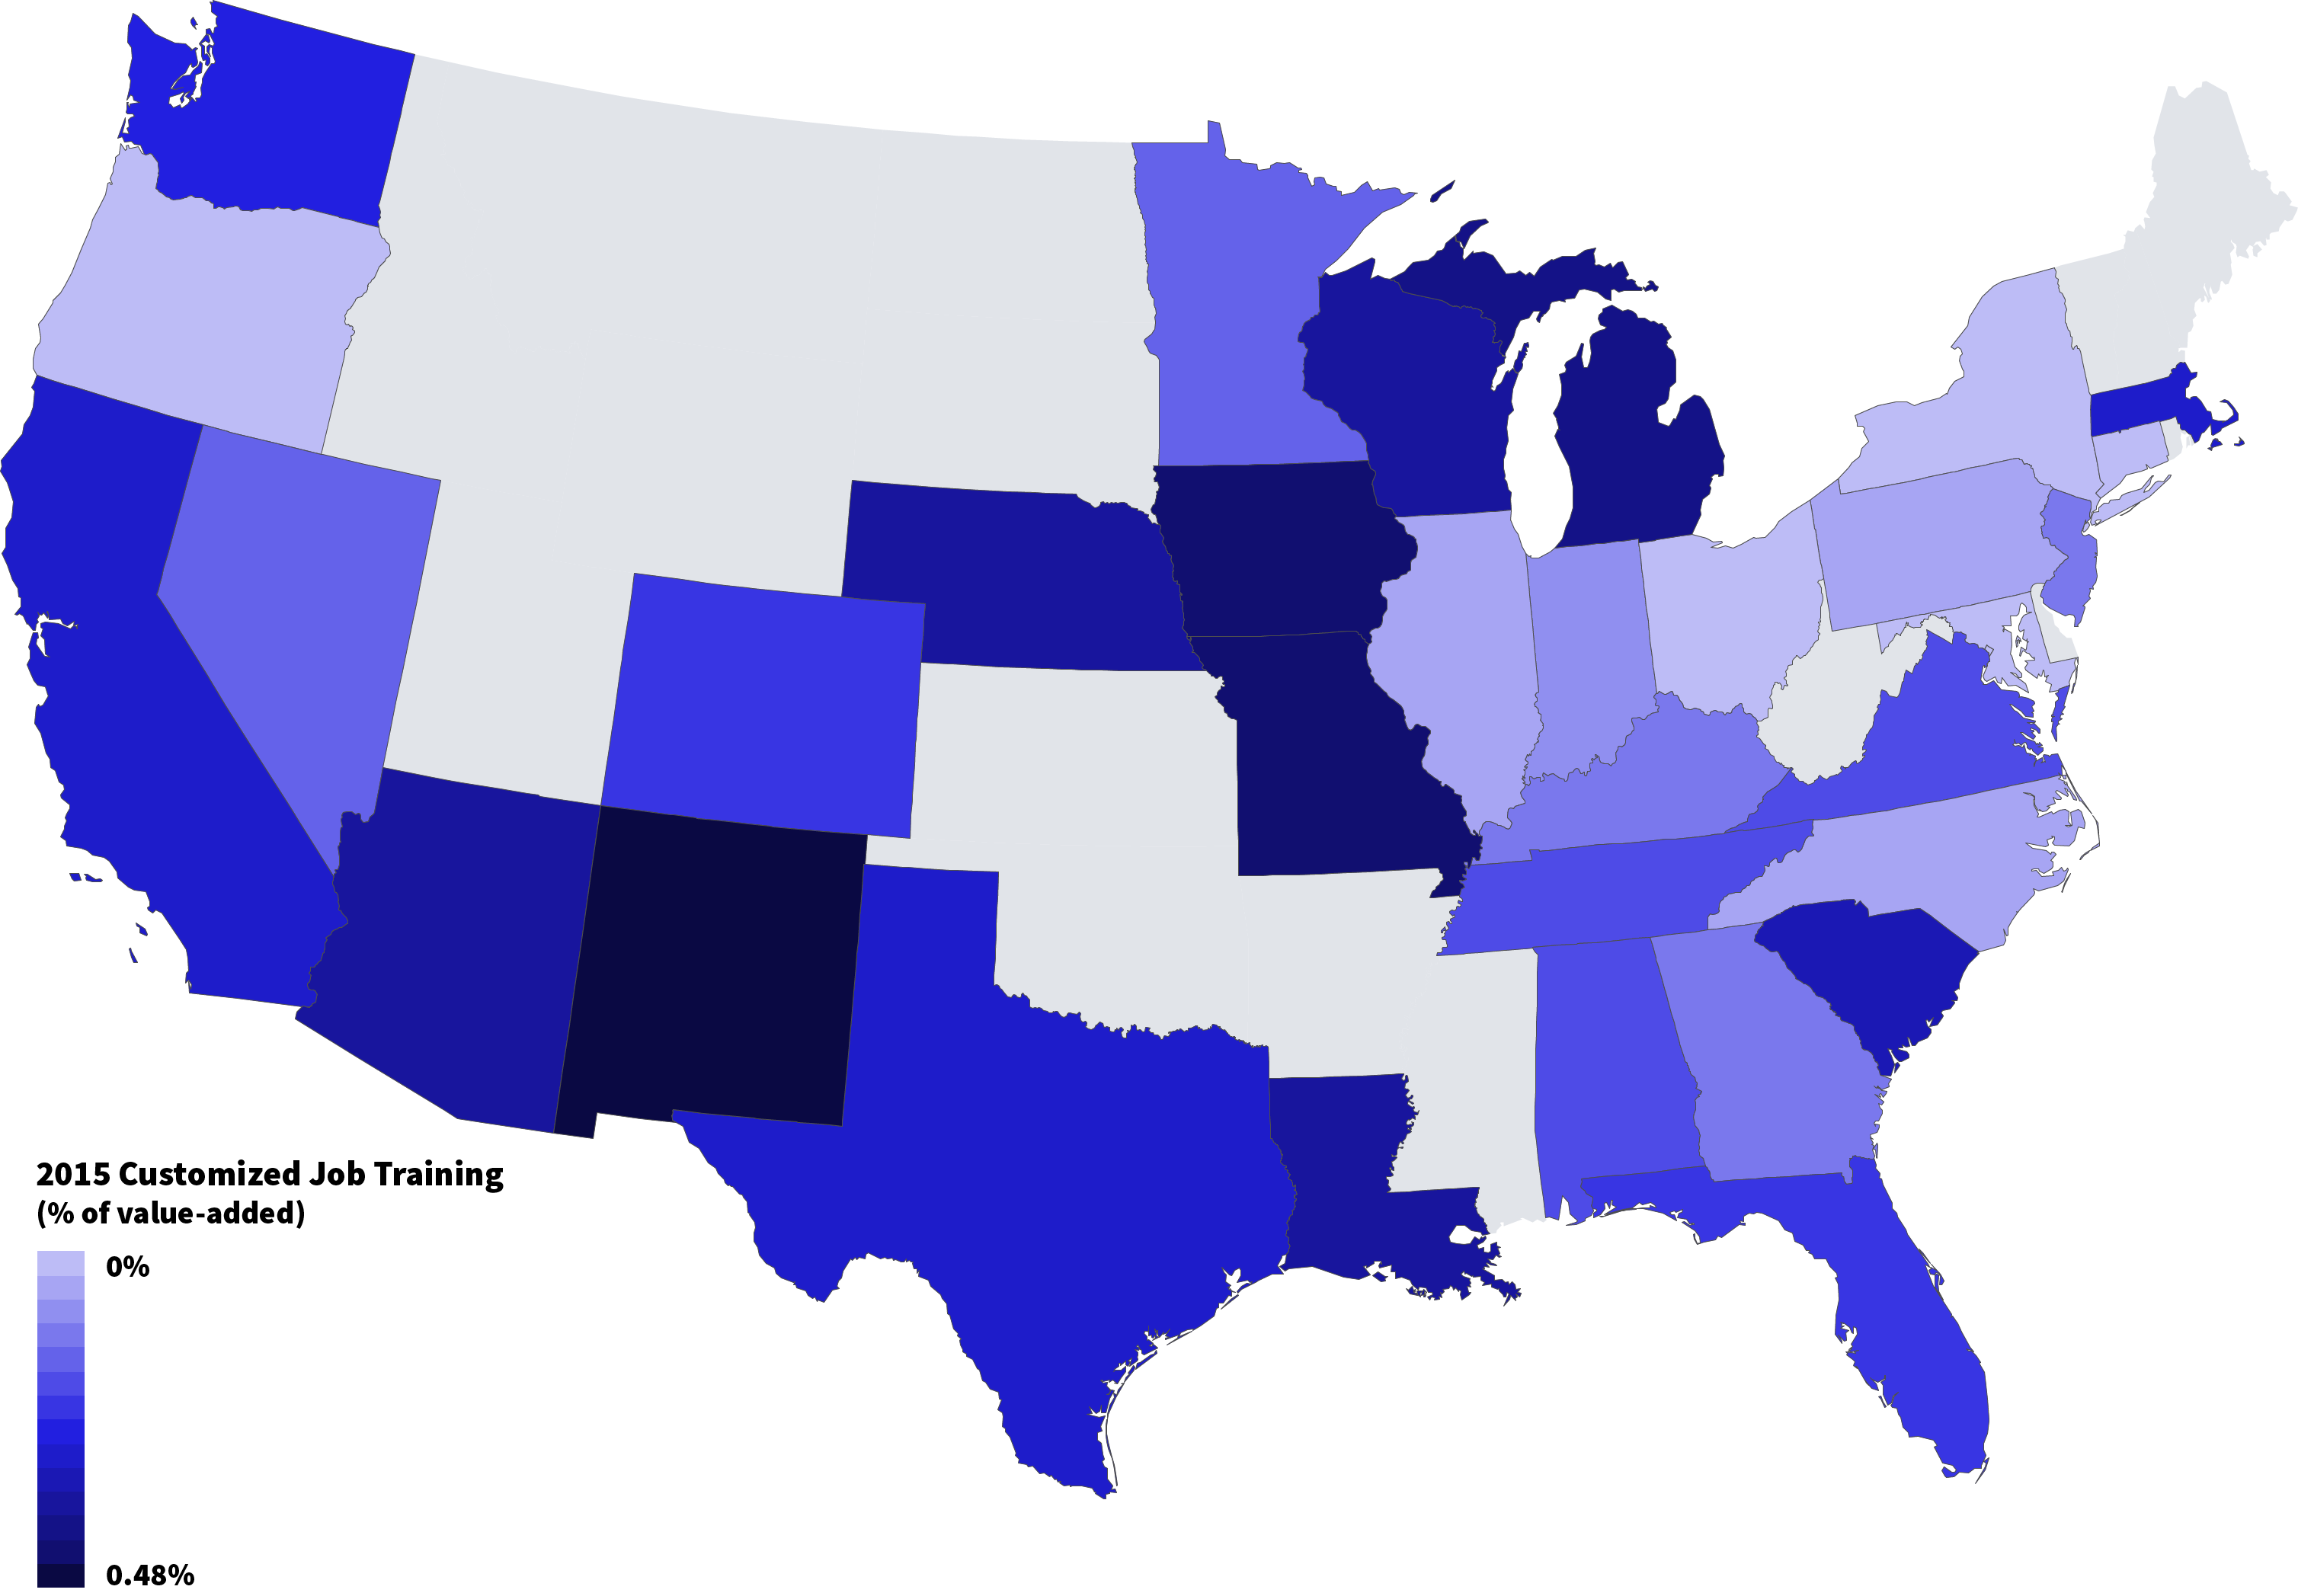
(10) Most states do not invest much in customized job training, which research suggests is a highly effective incentive.
Map Data
Some studies suggest that providing firms with customized services may be more cost-effective in boosting economic development than tax subsidies or other cash subsidies. In particular, research suggests that customized job training, in which local community colleges help train new workers to a firm's needs, may boost economic development by 5-10 times as much per dollar as is true of the average tax incentive. However, in most states, customized job training is a minor part of the incentive picture: Overall, customized job training makes up less than 5 percent of incentives, at only 0.07 percent of business value-added. A few states have much larger customized job training programs, including New Mexico, Iowa, Missouri, and Michigan.
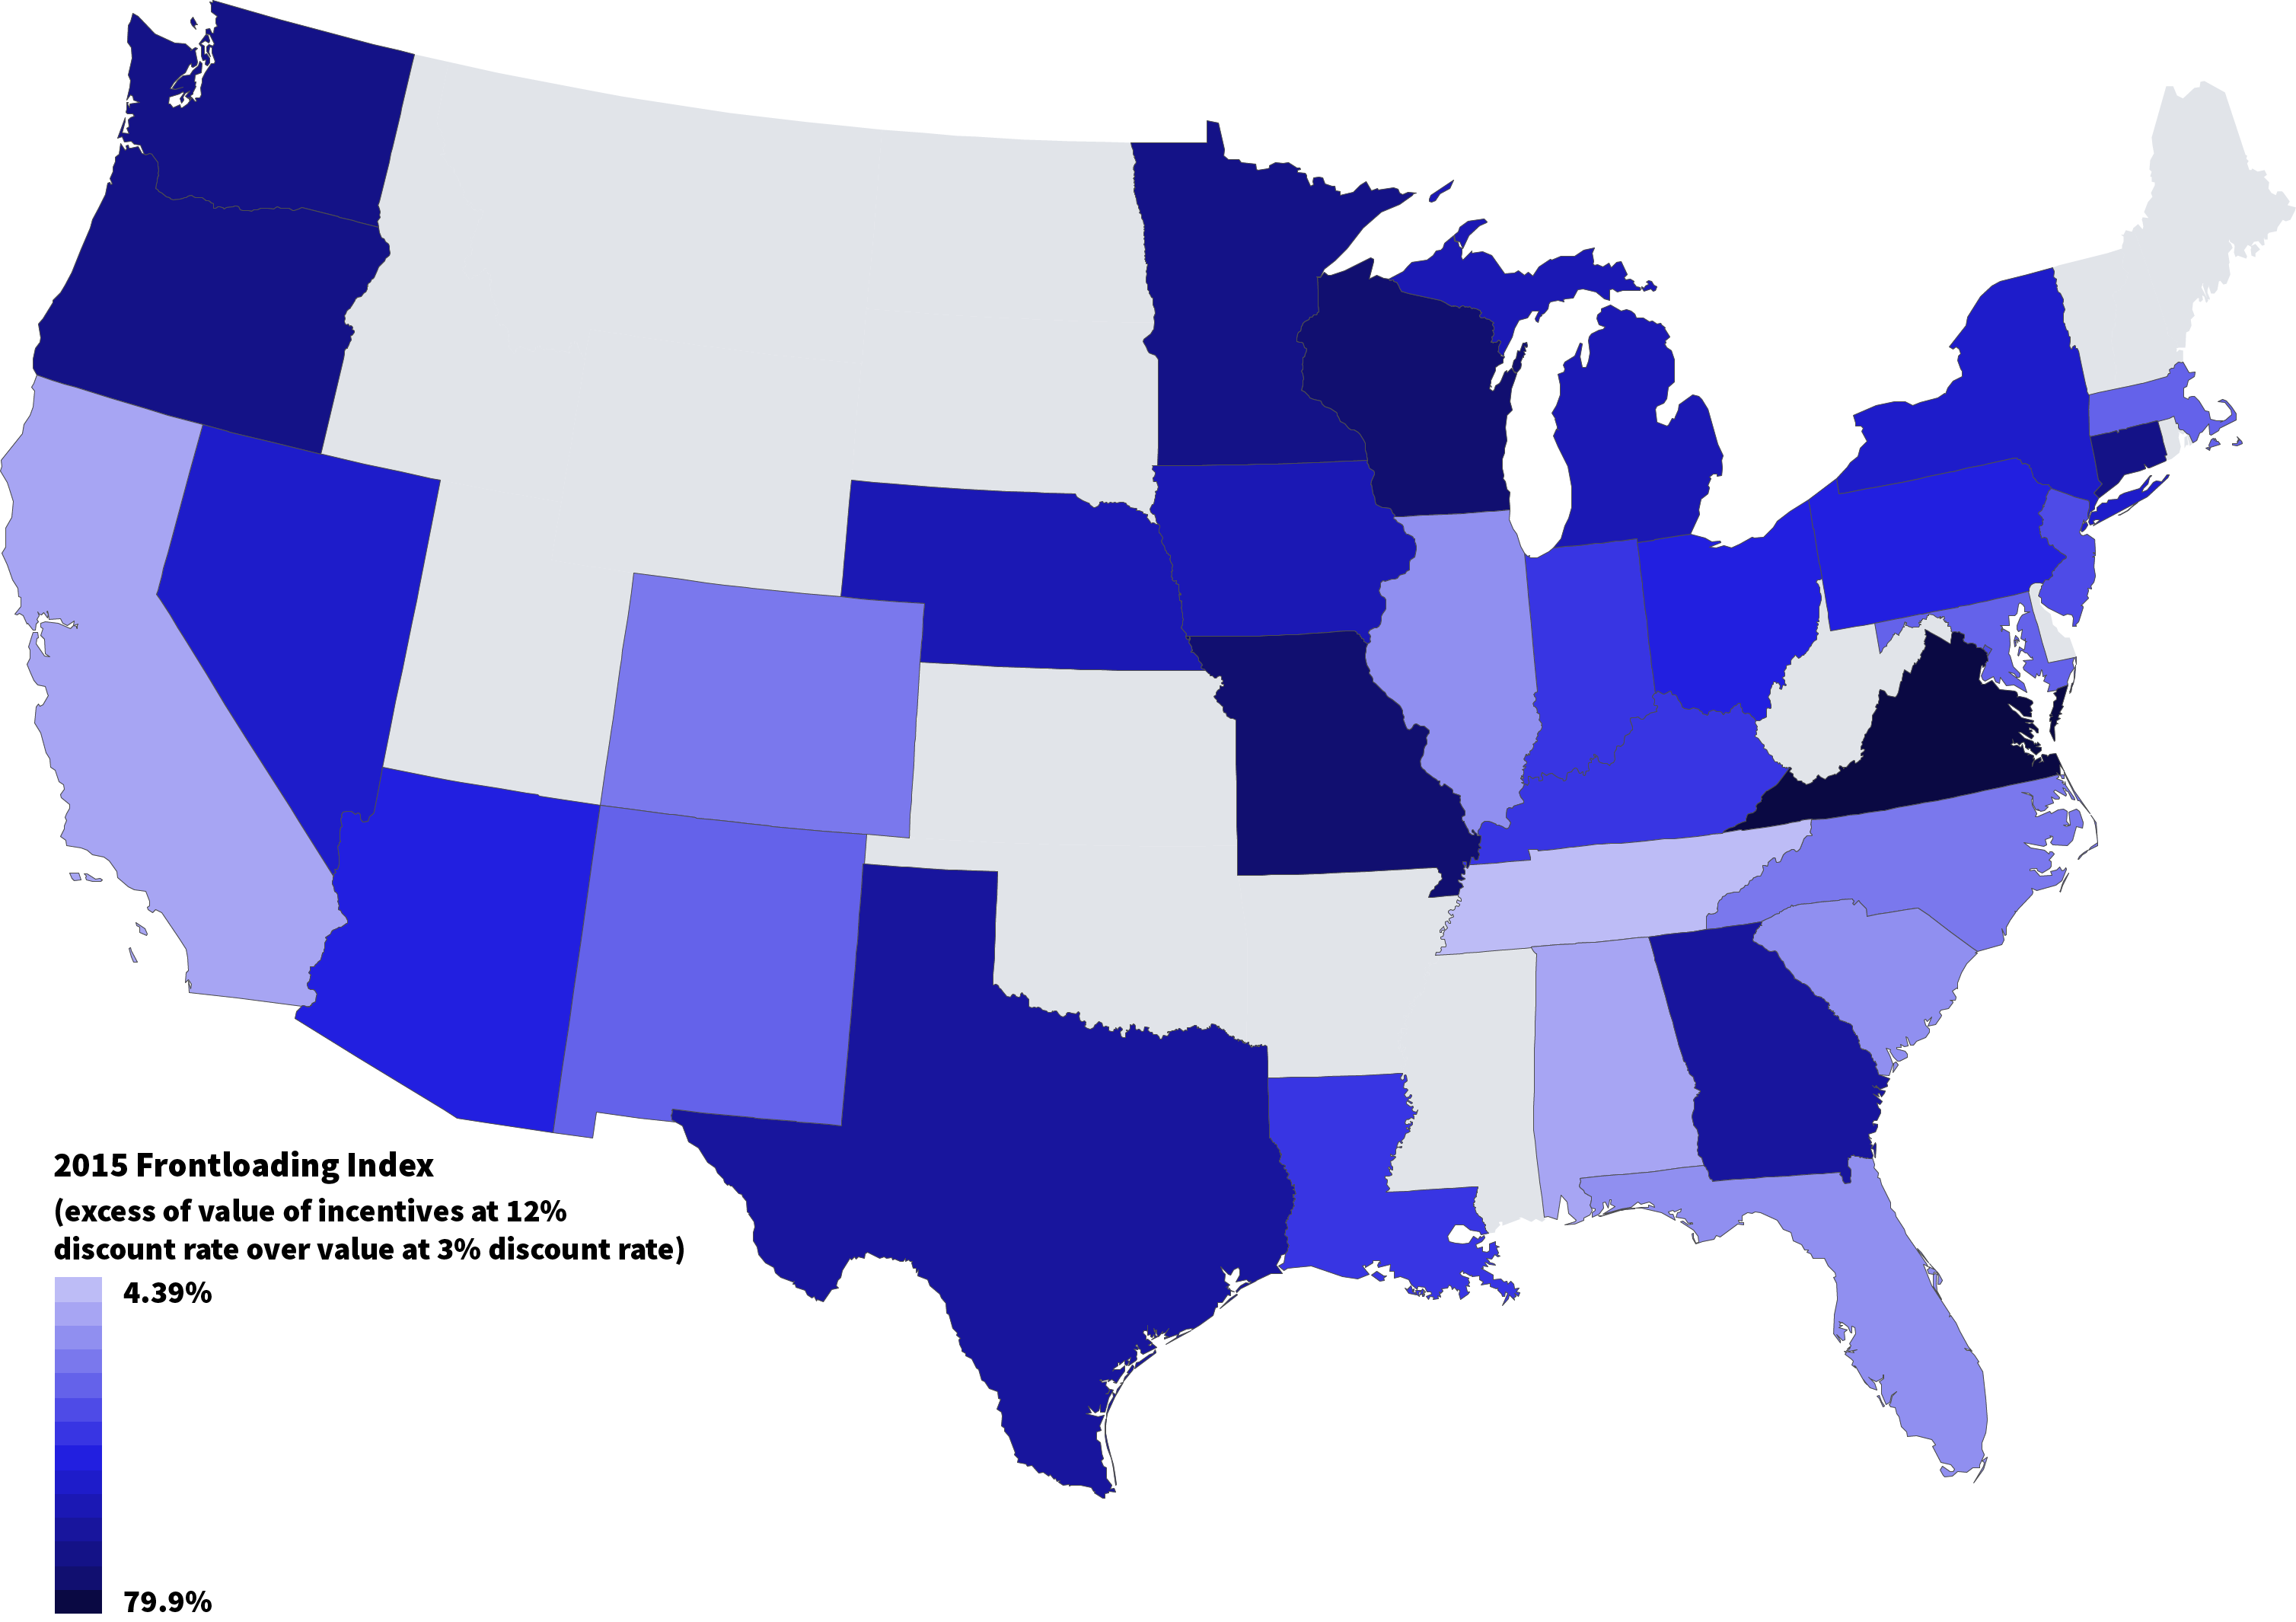
(11) Incentives are often provided for 10 or more years into the future, which research suggests does not much affect business location decisions.
Map Data
Another aspect of incentive design is the extent to which incentives are front-loaded. Business-location decision makers in many cases heavily discount the future. As a result, providing large incentives 10 or even 5 years from now may undermine the future tax base of a state without affecting location decisions as much as more up-front incentives. The trade-off is that up-front incentives are lost if the firm leaves. One way to ameliorate this trade-off is to provide more incentives up front but to include claw-back provisions requiring payback if the firm leaves within a specified time period. In general, most states do heavily front-load incentives. Particularly heavy front-loading states include Virginia, Missouri, Wisconsin, Oregon, and Washington. States that do relatively little front-loading include Tennessee, Alabama, California, Illinois, South Carolina, and Florida.
